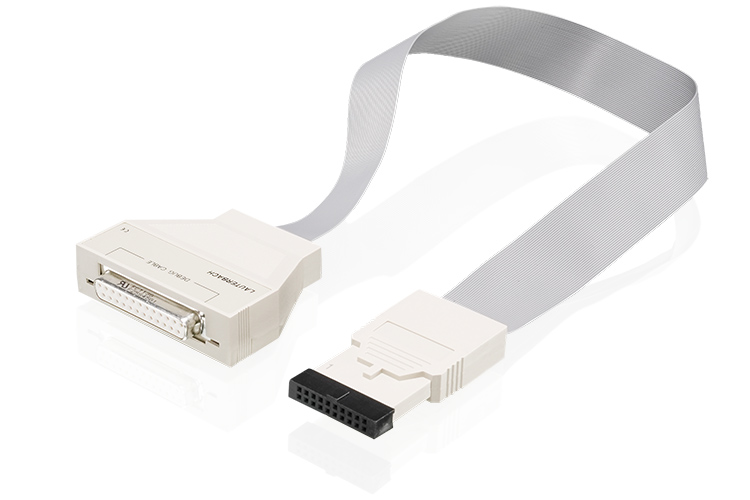
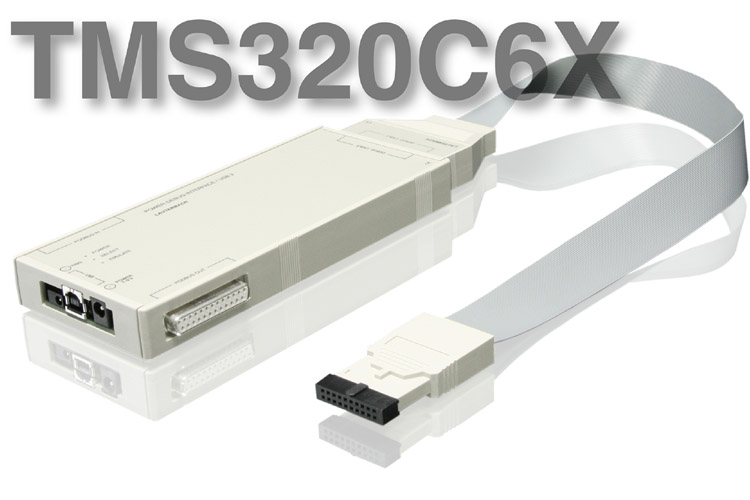
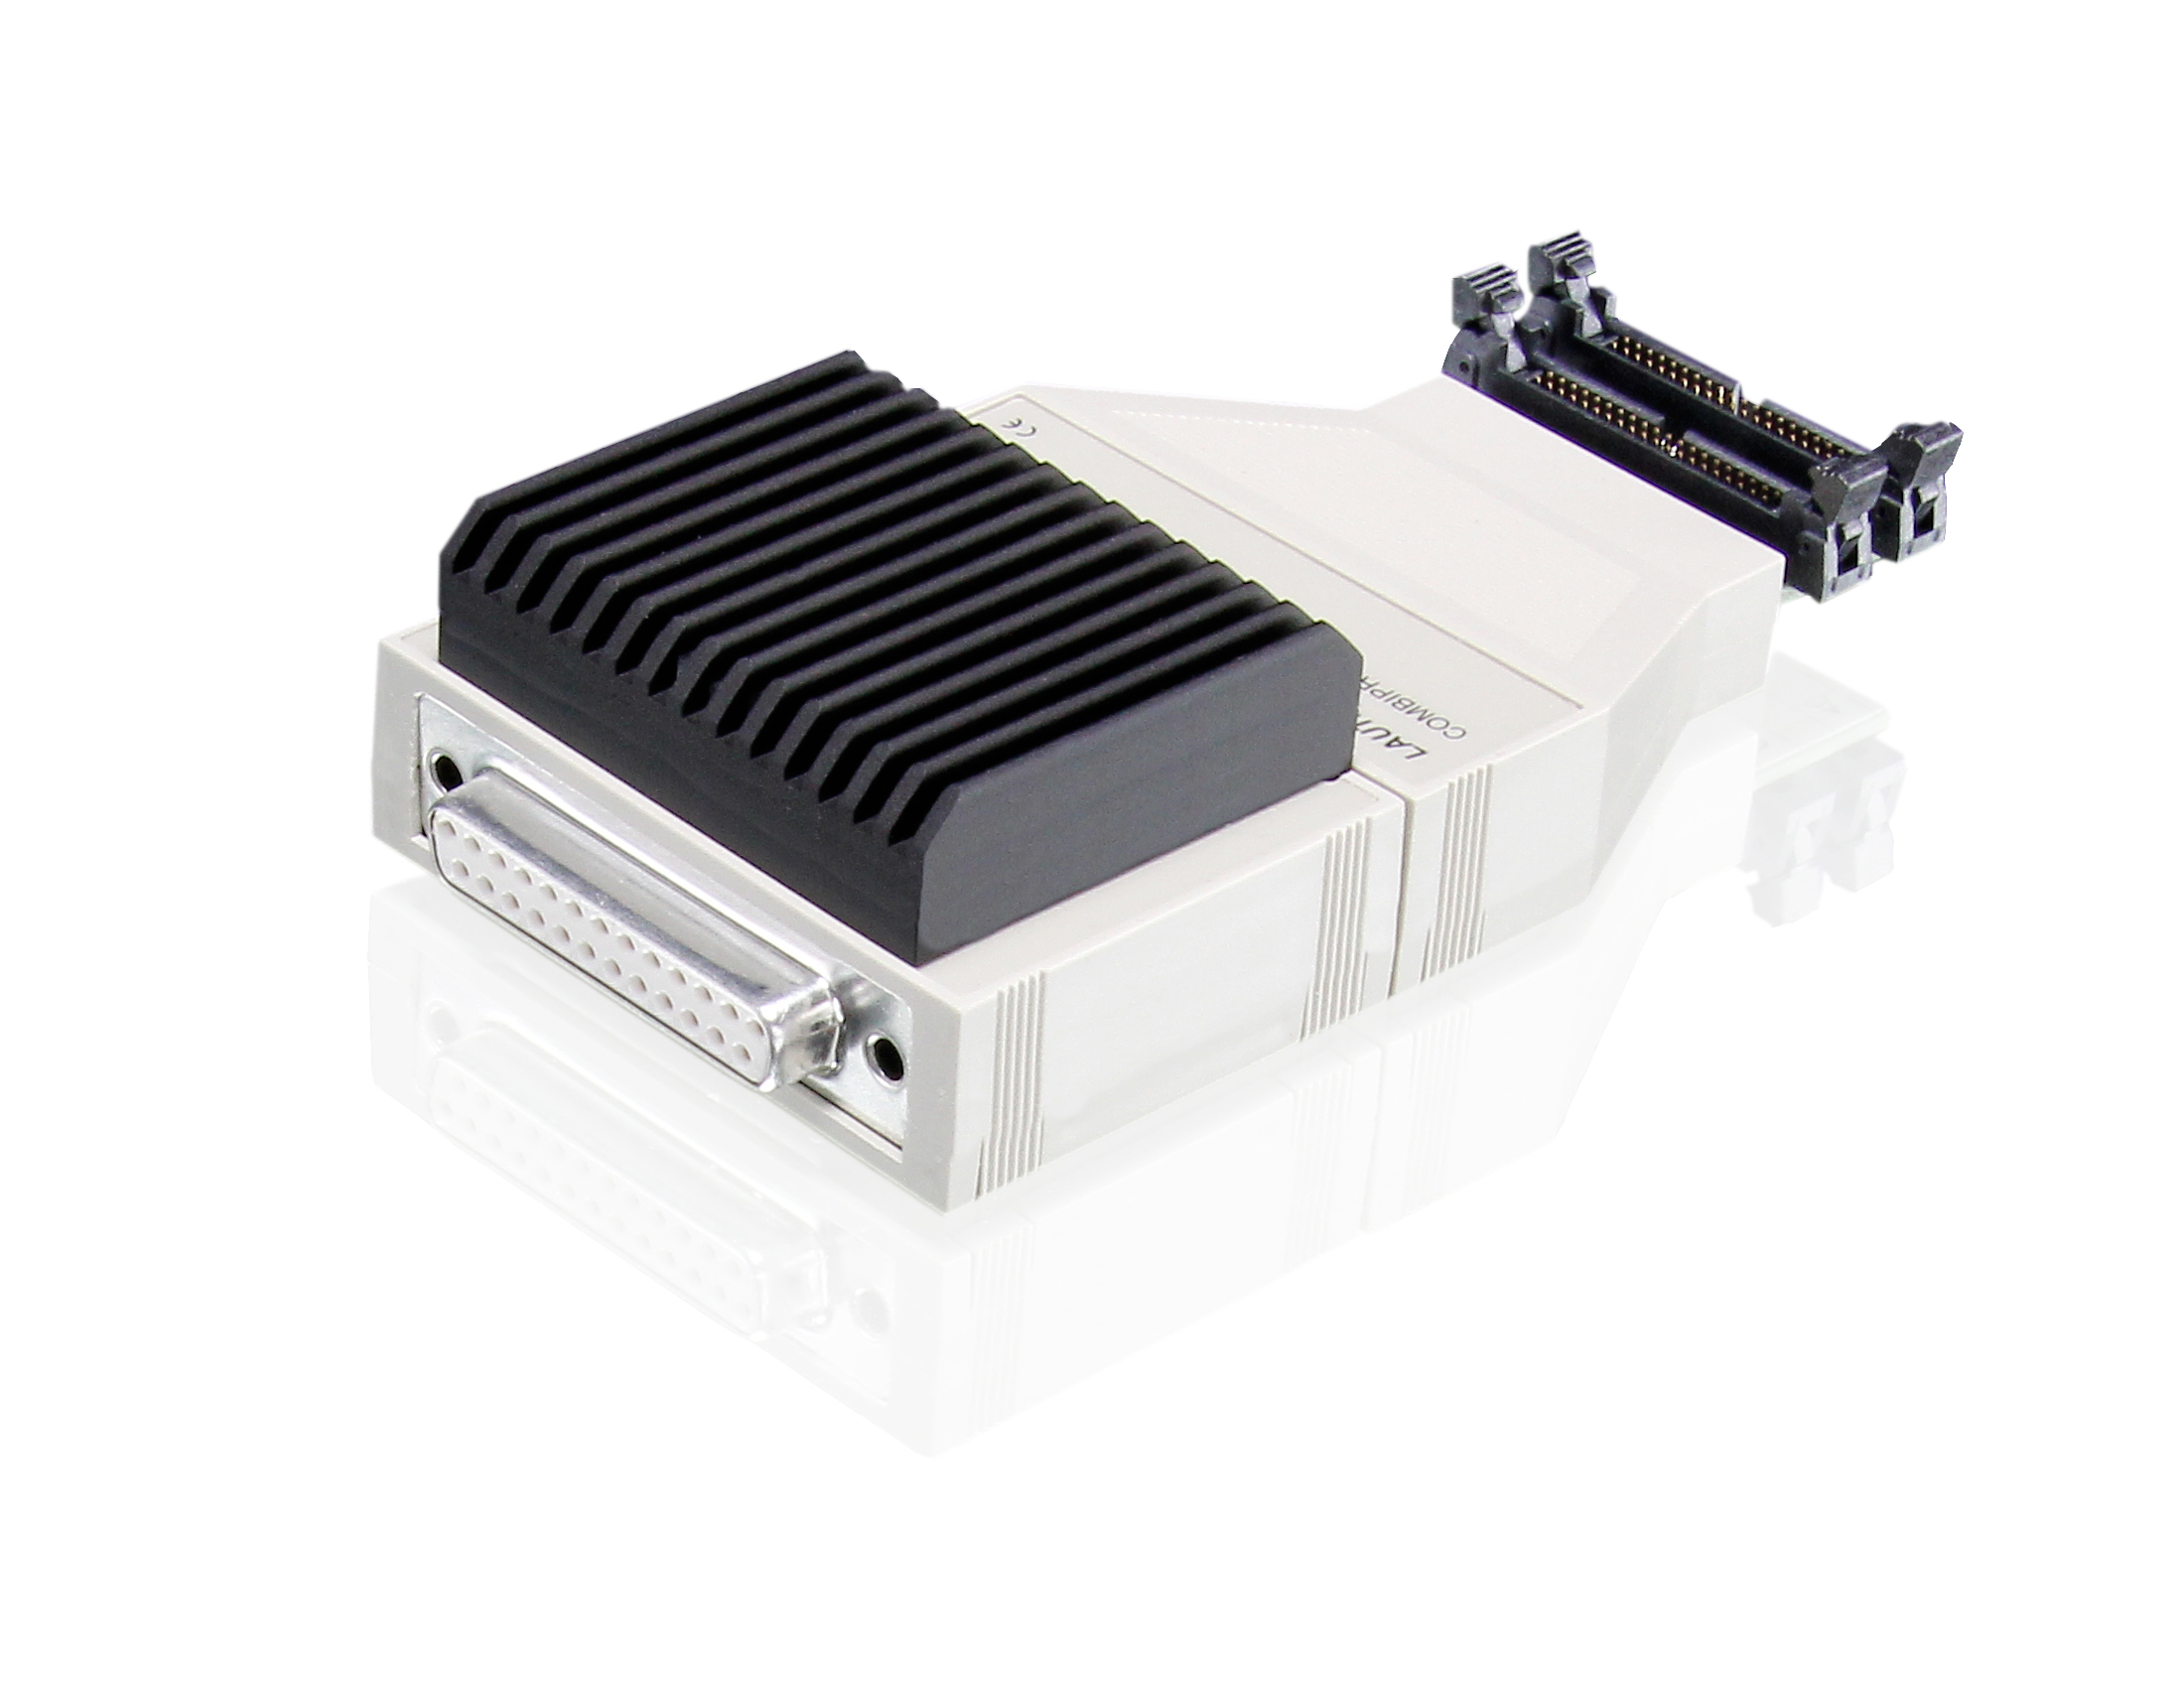
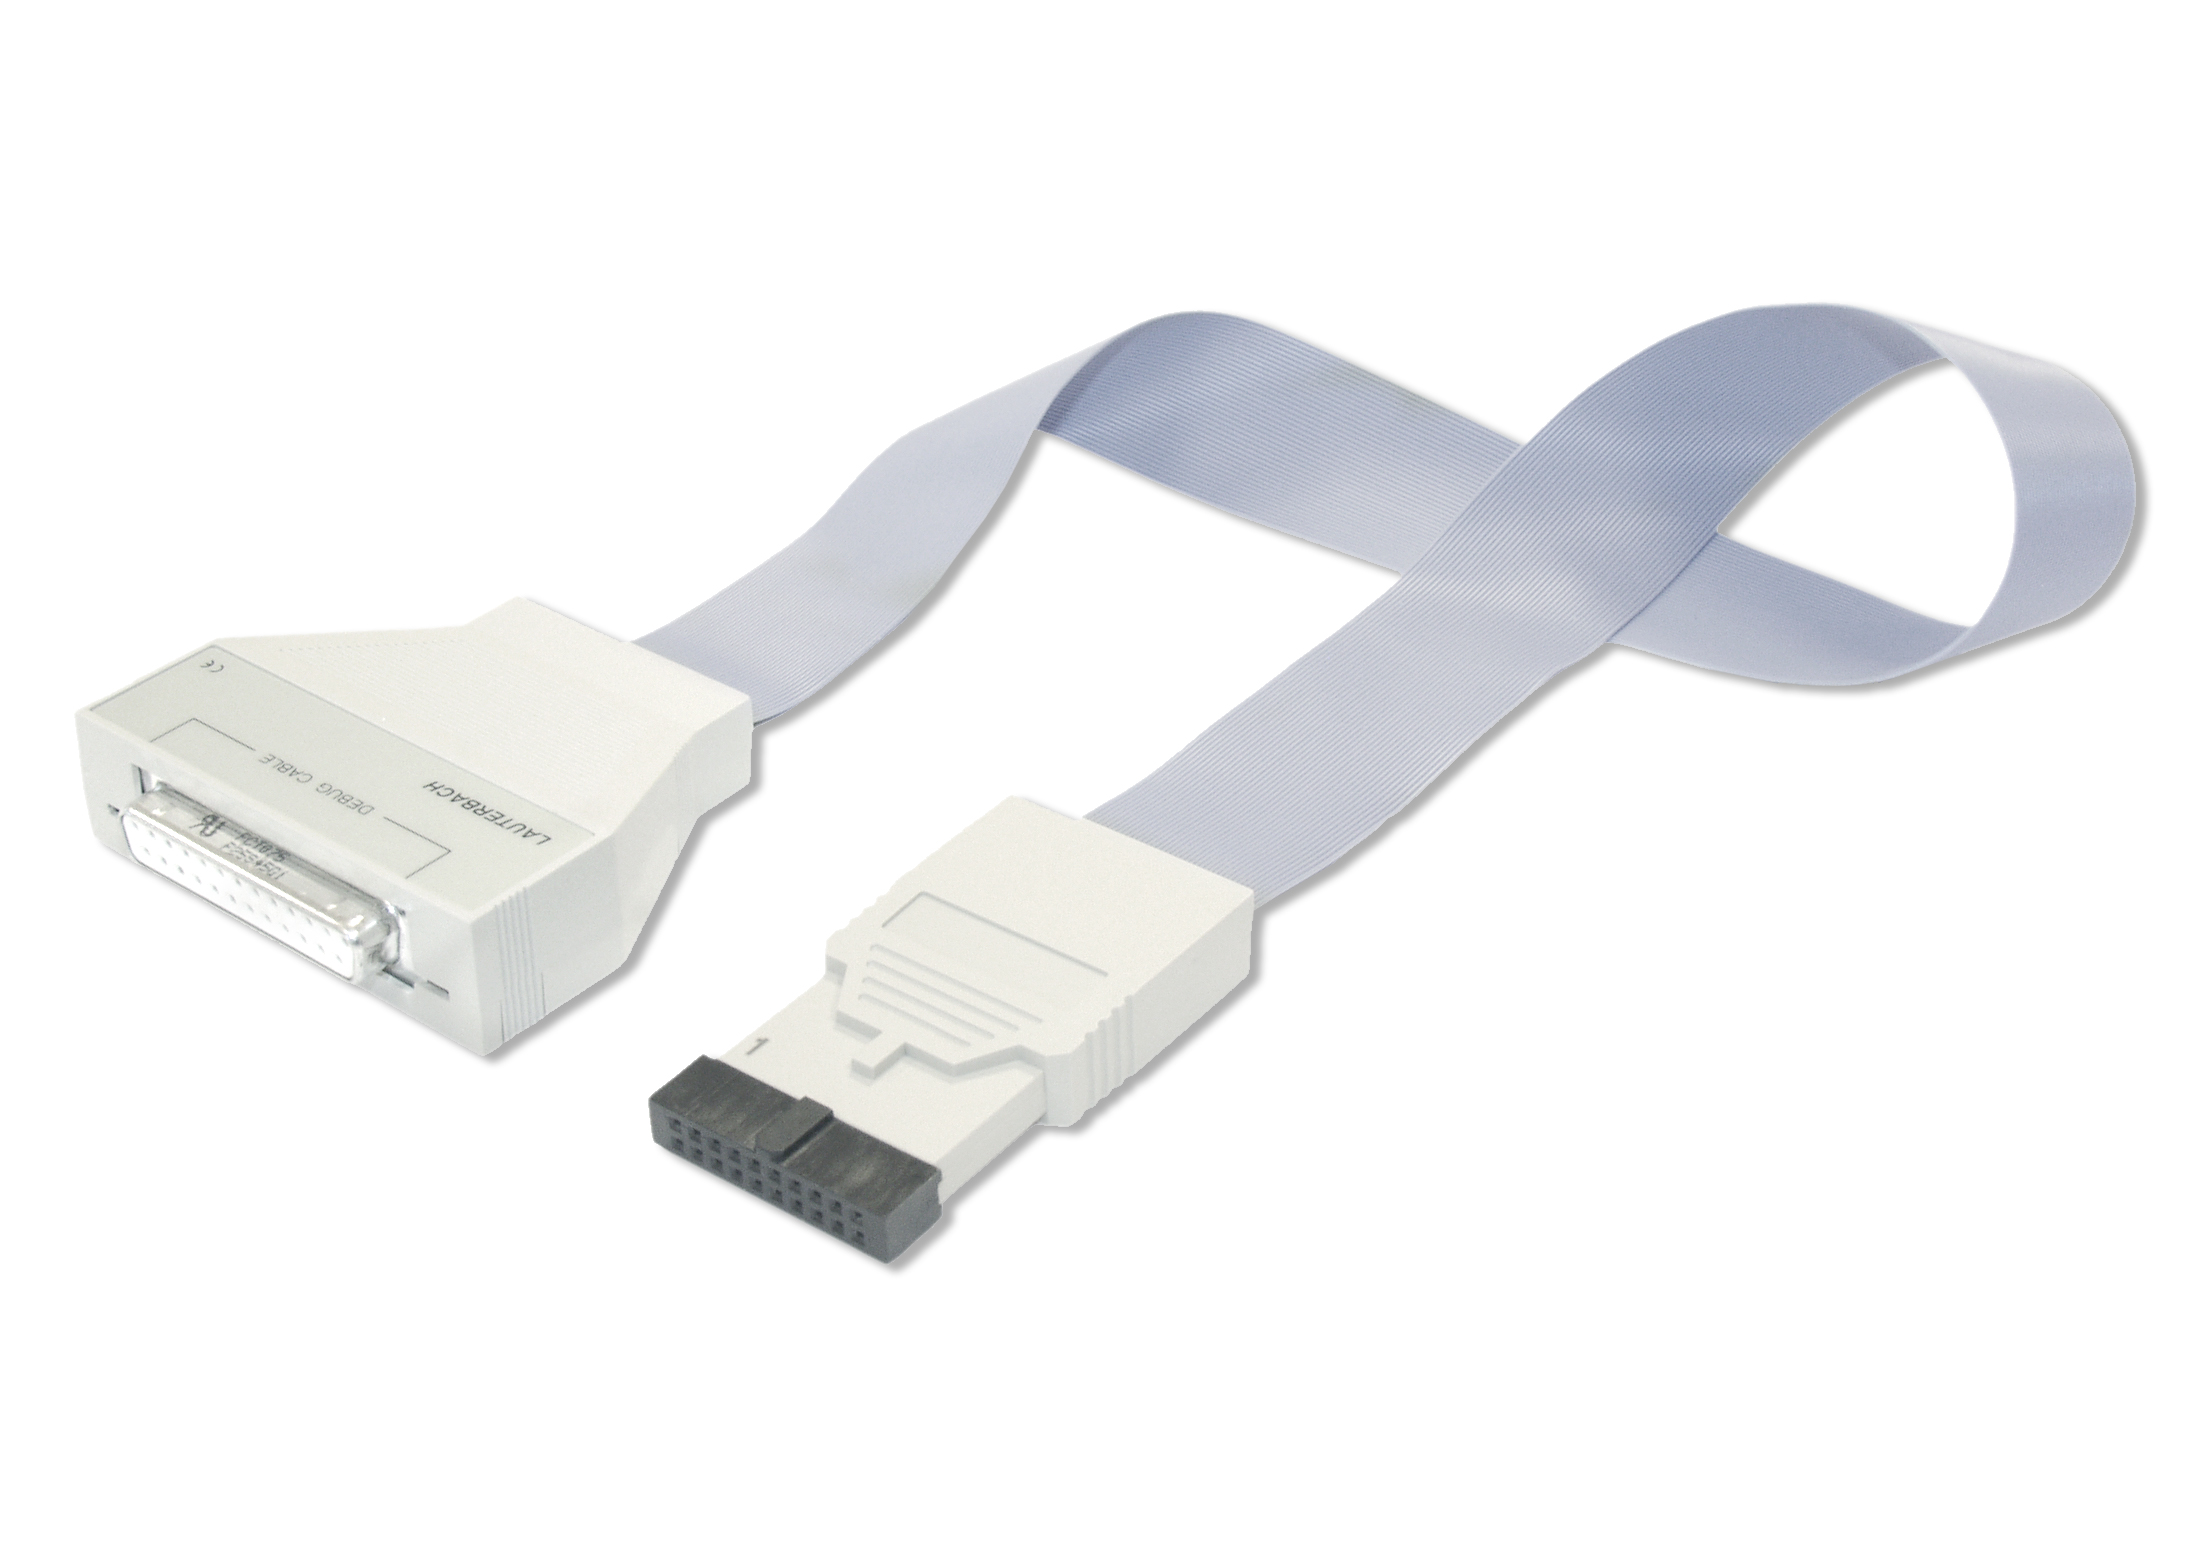
IDC20A Debug Probe
The Industry Standard for Almost Every Embedded Platform
The IDC20A debug probe was originally designed to debug SoCs with an Arm® CoreSight™ debug infrastructure. Due to the enormous success of the Arm architecture, this debug concept became the de-facto debug standard for multicore systems in the embedded market.
Today the IDC20A debug probe supports various of architectures and protocols to debug SoCs with and without CoreSight™ and is Lauterbach’s most successful debug probe.
Your Fast and Reliable Debug Probe for Almost Any Project
The IDC20A Debug Probe has been designed for maximum flexibility. Featuring the most common pin-out in the whole embedded market with a wide input voltage range and excellent signal integrity, it is a perfect fit for a large number of targets from general industrial applications to high-speed mobile device designs.
Supports even the most heterogeneous chips
When debugging multicore systems, it becomes essential that the debug probe is able to concurrently control cores of various architectures within one SoC. The IDC20A Debug Probe provides this flexibility and supports a wide range of architectures.
Perfect fit for almost any target
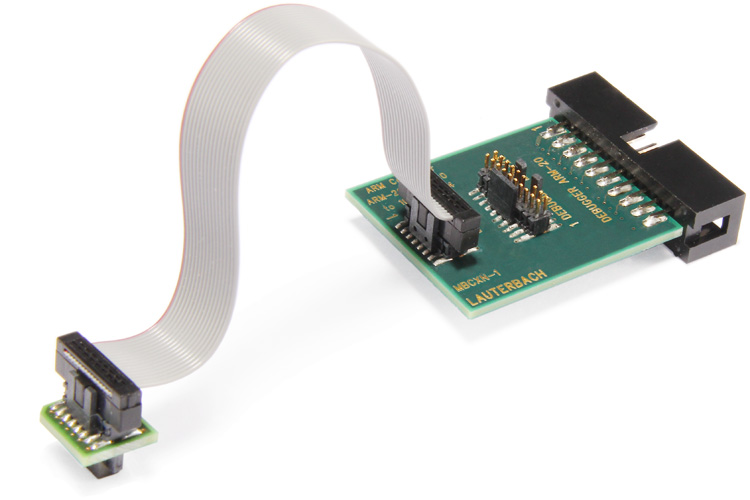
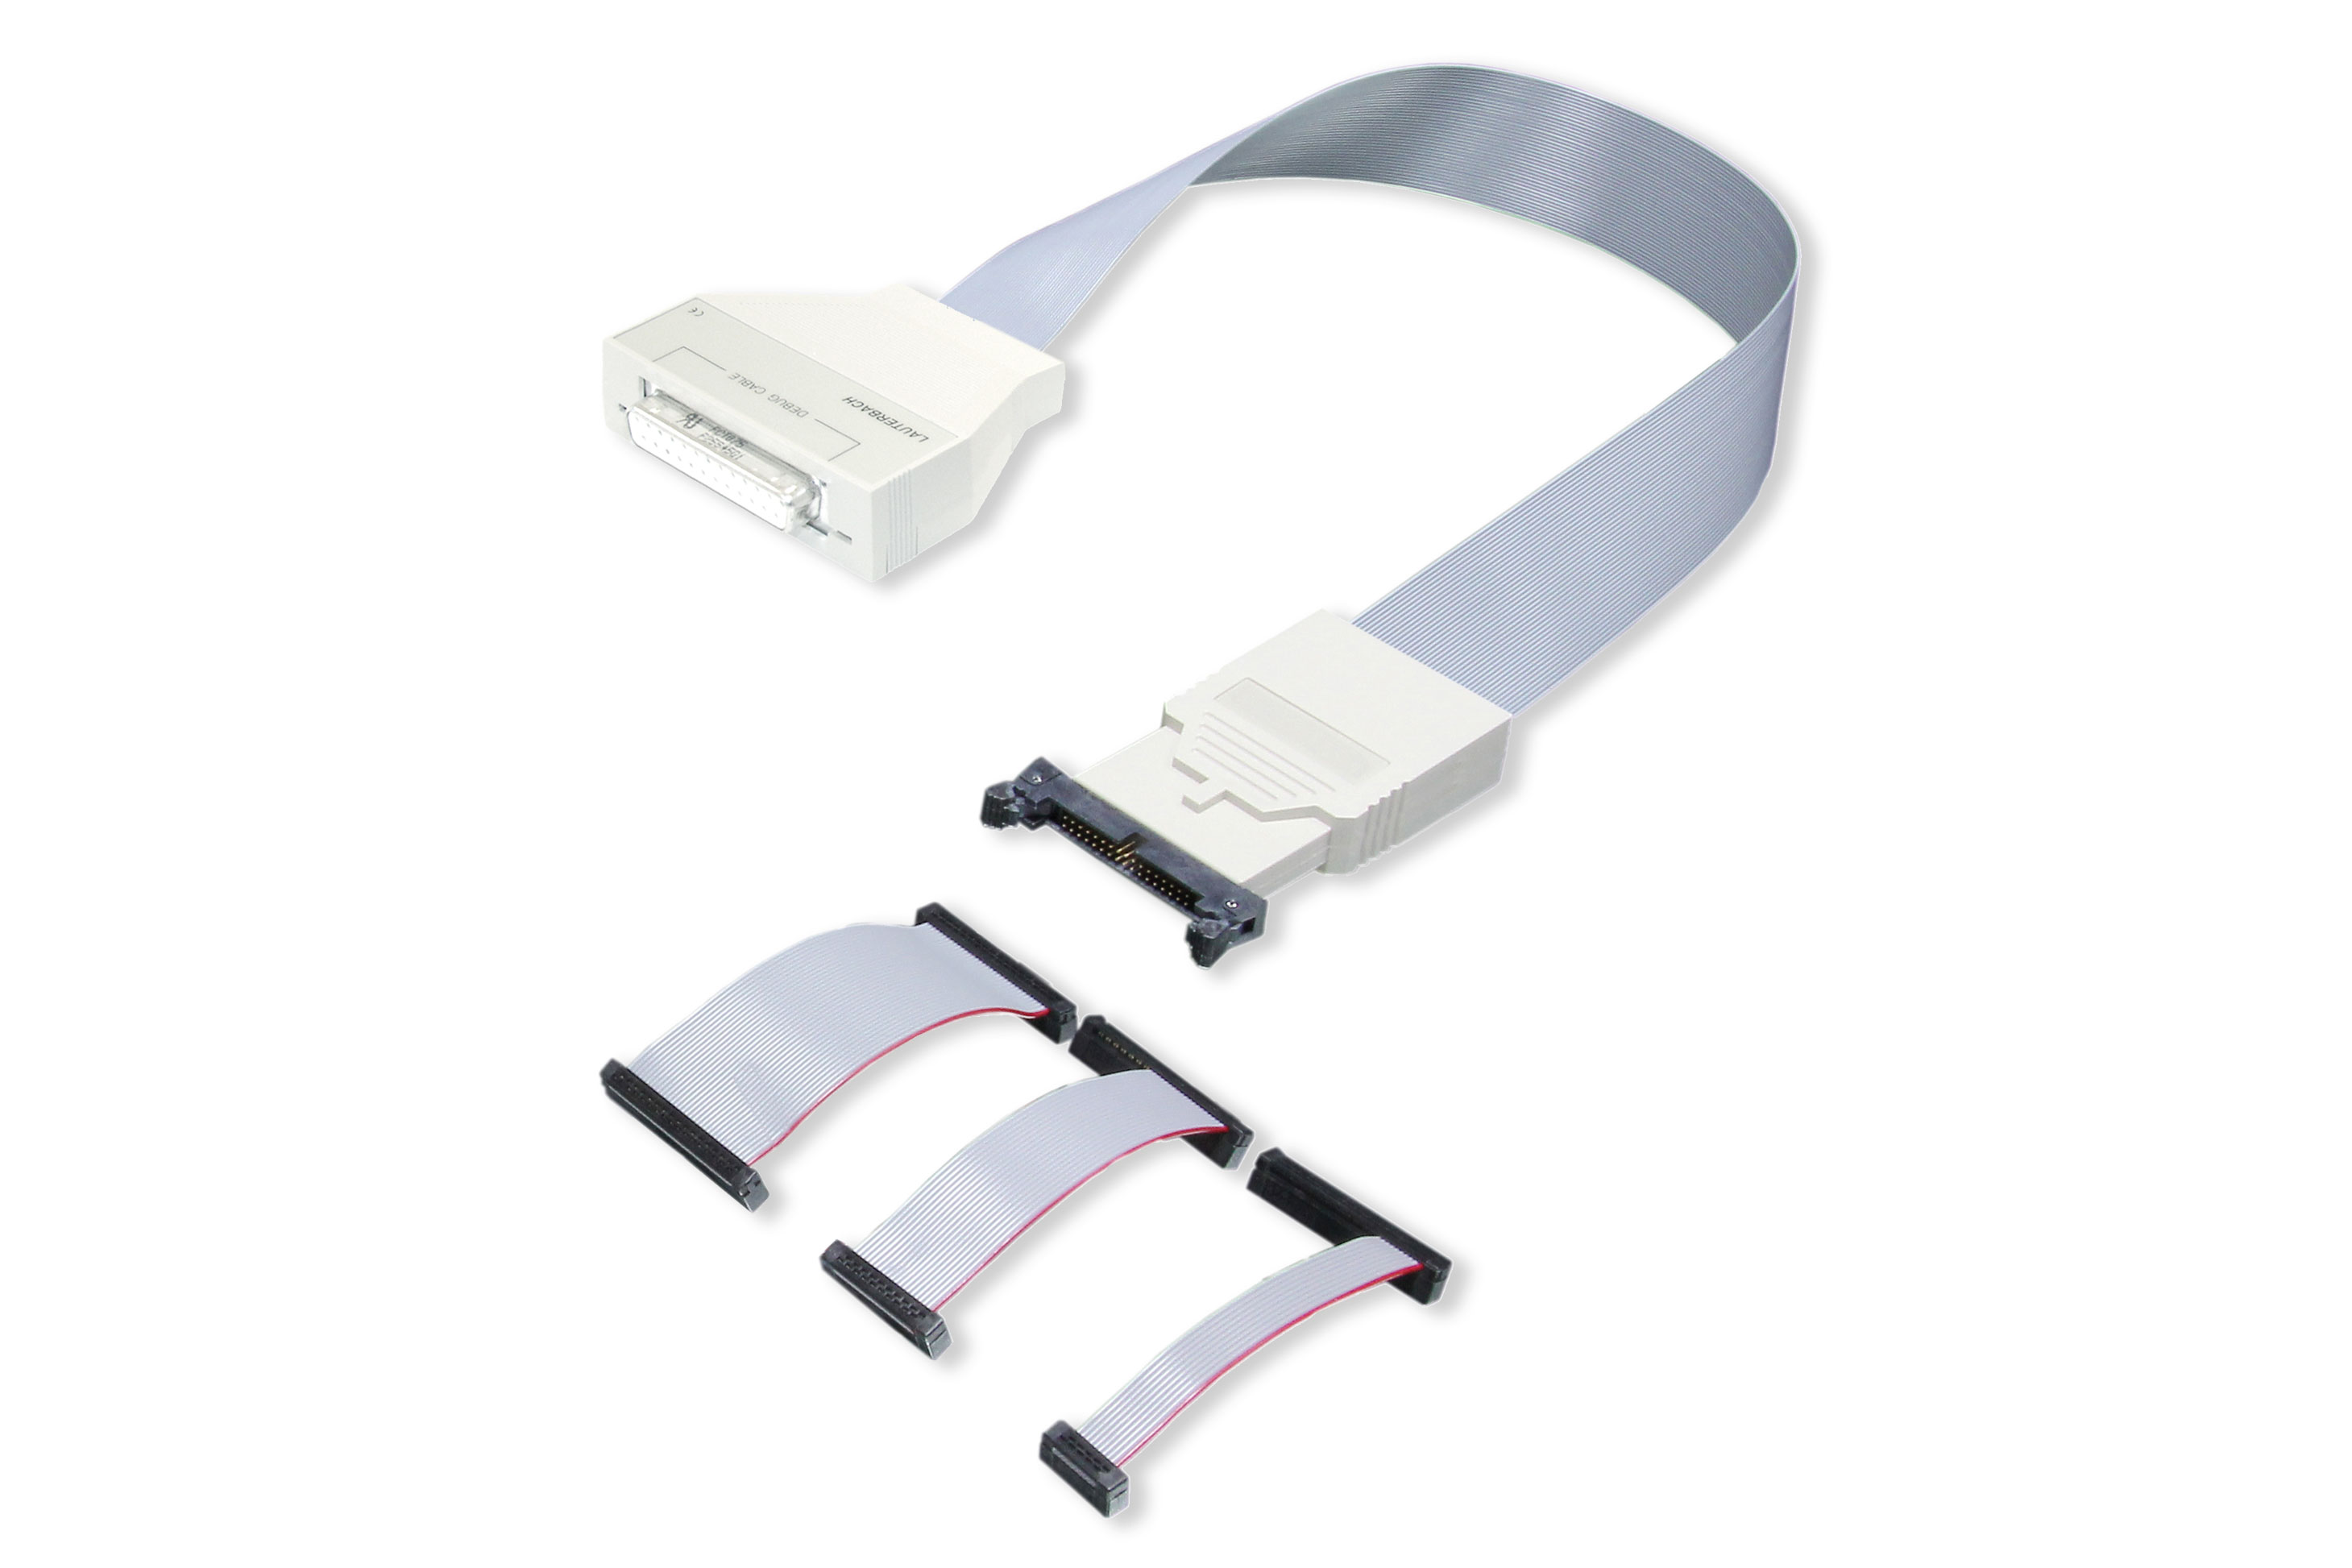
The IDC20A Debug Probe provides the most common pin-out in the embedded market. Together with a large selection of adapters it is the perfect fit for a wide range of targets.
High transfer speed and signal integrity
With transceivers located close to the target, the IDC20A Debug Probe provides highest signal integrity at highest transfer speeds. For appropriate processors the high throughput performance even allows some real time tracing.
Wide Voltage Range starting from 0.4V
Supports high-speed targets with low I/O voltages down to 0.4 V as well as standard industrial applications with I/O voltages up to 5V.
Get Control of Almost Any Chip
The IDC20A is a standard debug probe for a number of industries including mobile communications, medical, consumer electronics, semiconductors, aerospace, industrial and others. It supports dozens of architectures, from today's established microarchitectures to trendy new architectures. IDC20A covers chips from tiny microcontrollers to the most complex SoCs, Soft-Cores (implemented in FPGAs) and various sub-controllers like DSPs.
Arm/Cortex
AndesCore
APEX
APS3
ARC
AVR8
ARP32
Beyond
C166SV2
C2000
C5000
C6000
C7000
CEVA-X
HC11
Hexagon
i8051
M32R
Meta
Mico32
MicroBlaze
NIOS-II
PRU
RISC-V
SDMA
SH
SRP
StarCore
STM8
STRED
Synopsys-ASIP
Teak/TeakLite
Ubicom32
Xtensa
ZSP
78k
Universal Debug Protocol Support
JTAG (IEEE 1149.1)
JTAG is the debug protocol commonly available with most CPUs. Derived from Boundary Scan device test-ing, JTAG allows an external tool to communicate with a Test Access Point (TAP) controller inside a chip. A TAP is the access point to the debug infrastructure within a chip. TAPs can be chained to allow the debug-ging of several cores via a single debug probe.
cJTAG (compact JTAG) (IEEE 1149.7)
Compact JTAG (cJTAG) is a technology based on JTAG which reduces the pin count of the debug interface by serializing the JTAG communication between the debugger and the core’s Test Access Points (TAPs). Multiple chips can be supported in a star topology. Compared to normal JTAG, it saves costs for physical pins with a slightly reduced debug performance.
SWD/SWO
SWD (Serial Wire Debug) is a 2-pin debug interface defined by Arm®, which is optimized to access the CoreSight™ debug infrastructure with maximum performance. Serial Wire Output (SWO) is an optional extension pin to SWD. If a processor has an SWO pin, the IDC20A debug probe is able to receive trace data from both code instrumentation and data accesses*.
*Supported by PowerDebug E40/PowerDebug Pro and newer base modules
Renesas Single-Wire UART
RL78 processors are debugged via a UART like 1-line debug interface using the pins RESET and TOOL0, while the older 78K0R processors use an additional signal TOOL1.
UPDI
The Unified Program and Debug Interface (UPDI) designed by Microchip is a proprietary protocol to debug and program tinyAVR® and megaAVR® devices through a single pin, which is also the chip’s reset pin. These devices can also be programmed via a Serial Peripheral Interface (SPI).
Andes Serial Debug Port
Serial Debug Port is a two-wire option for AndesCore™ and RISC-V processors designed by Andes Technology.
Technical Information for the IDC20A Debug Probe
| Voltage Range | 0.4V – 5.0 V |
|---|---|
| Maximal Frequency | 10 kHz … 100 MHz |
Get the IDC20A Probe for Your Architecture
IDC20A Debug Probe with debug license to debug Cortex-M cores (Armv6/7/8-M) and SecurCore SC000/SC300, via JTAG, cJTAG (IEEE 1149.7), or Serial Wire Debug (SWD). Includes licenses to debug and trace Cortex-M cores and SecurCore SC000/SC300, as well as debug GTM and IPU cores. Includes TRACE32 software for Windows, Linux and macOS on DVD or via download. With legacy debug modules LA-7702/LA-7704 only JTAG is supported. Voltage range 0.4V to 5.0V.
IDC20A debug cable for 64-bit RISC-V cores (RV64) usable with a PowerDebug base module supporting JTAG, cJTAG and Serial Wire Debug Port (0.4 - 5.0V). Includes license for multicore debugging. Includes TRACE32 software for Windows, Linux and macOS on DVD or via download. Requires TRACE32 software R.2020.09 or newer. Requires a PowerDebug base module. A range of converters are available to adapt to different target connectors (including MIPI pinouts).
supports Xtensa Cores from Tensilica via an ARM JTAG interface core trace decoding for TRAX (Trace RAM within core logic) included includes software for Windows, Linux and MacOSX requires Power Debug Module IDC20A debug cable requires LA-3763 if 14 pin JTAG (Xtensa) connector is used
Supports Xtensa Cores from Tensilica via an ARM JTAG interface Core trace decoding for TRAX (Trace RAM within core logic) included IDC20A debug cable, which supports 5-pin standard JTAG, cJTAG (IEEE 1149.7) and serial Wire Debug (SWD), (0.4V - 5V) Includes software for Windows, Linux and macOS Requires PowerDebug module Requires LA-3763 if 14 pin JTAG (Xtensa) connector is used
IDC20A debug cable for 32-bit ARC cores from Synopsys inlcuding ARC EM, ARC HS3x/4x, ARC EV/VPX/NPX, ARC 600/700, ARCtangent-A4/A5 usable with a PowerDebug base module supporting JTAG, cJTAG and Serial Wire Debug Port (0.4 - 5.0V). Includes TRACE32 software for Windows, Linux and macOS on DVD or via download. Requires a PowerDebug base module. For ARC-V you require a RISC-V probe instead (LA-3200 or LA-3201).
IDC20A debug cable for Hexagon DSPs and NPUs from Qualcomm usable with a PowerDebug base module supporting JTAG, cJTAG (IEEE 1149.7) and Serial Wire Debug Port (SWD). Voltage range 0.4V to 5.0V. Includes license for multicore debugging and trace decoding. Includes TRACE32 software for Windows, Linux and macOS on DVD or via download. Requires a PowerDebug base module.
IDC20A Debug Probe with a license for debugging of C28x and C29x microcontrollers via JTAG, cJTAG (IEEE 1149.7), or Serial Wire Debug (SWD). Includes licenses to debug Control Law Accelerator (CLA). Includes licenses for onchip trace "PC Trace". ("PC Trace" supports up to 128 program branches.) Includes TRACE32 software for Windows, Linux and macOS on DVD or via download. Requires a PowerDebug base module. Requires LA-3780 if you need to adapt to a TI-14 or TI-20-Compact target header. Voltage range 0.4V to 5.0V.
Supports C6xxx. Uses IDC20A debug cable, which supports 5-pin standard JTAG, cJTAG (IEEE 1149.7) and Serial Wire Debug (SWD), (0.4V - 5V) Includes software for Windows, Linux and macOS. Requires PowerDebug base module. Requires LA-7748 if 14 pin TI target adapter is used.
Supports C7000. Uses IDC20A debug cable, which supports 5-pin standard JTAG, cJTAG (IEEE 1149.7) and Serial Wire Debug (SWD), (0.4V - 5V) Includes software for Windows, Linux and macOS. Requires PowerDebug base module. Requires LA-7748 if 14 pin TI target adapter is used.
Connect to Every Target
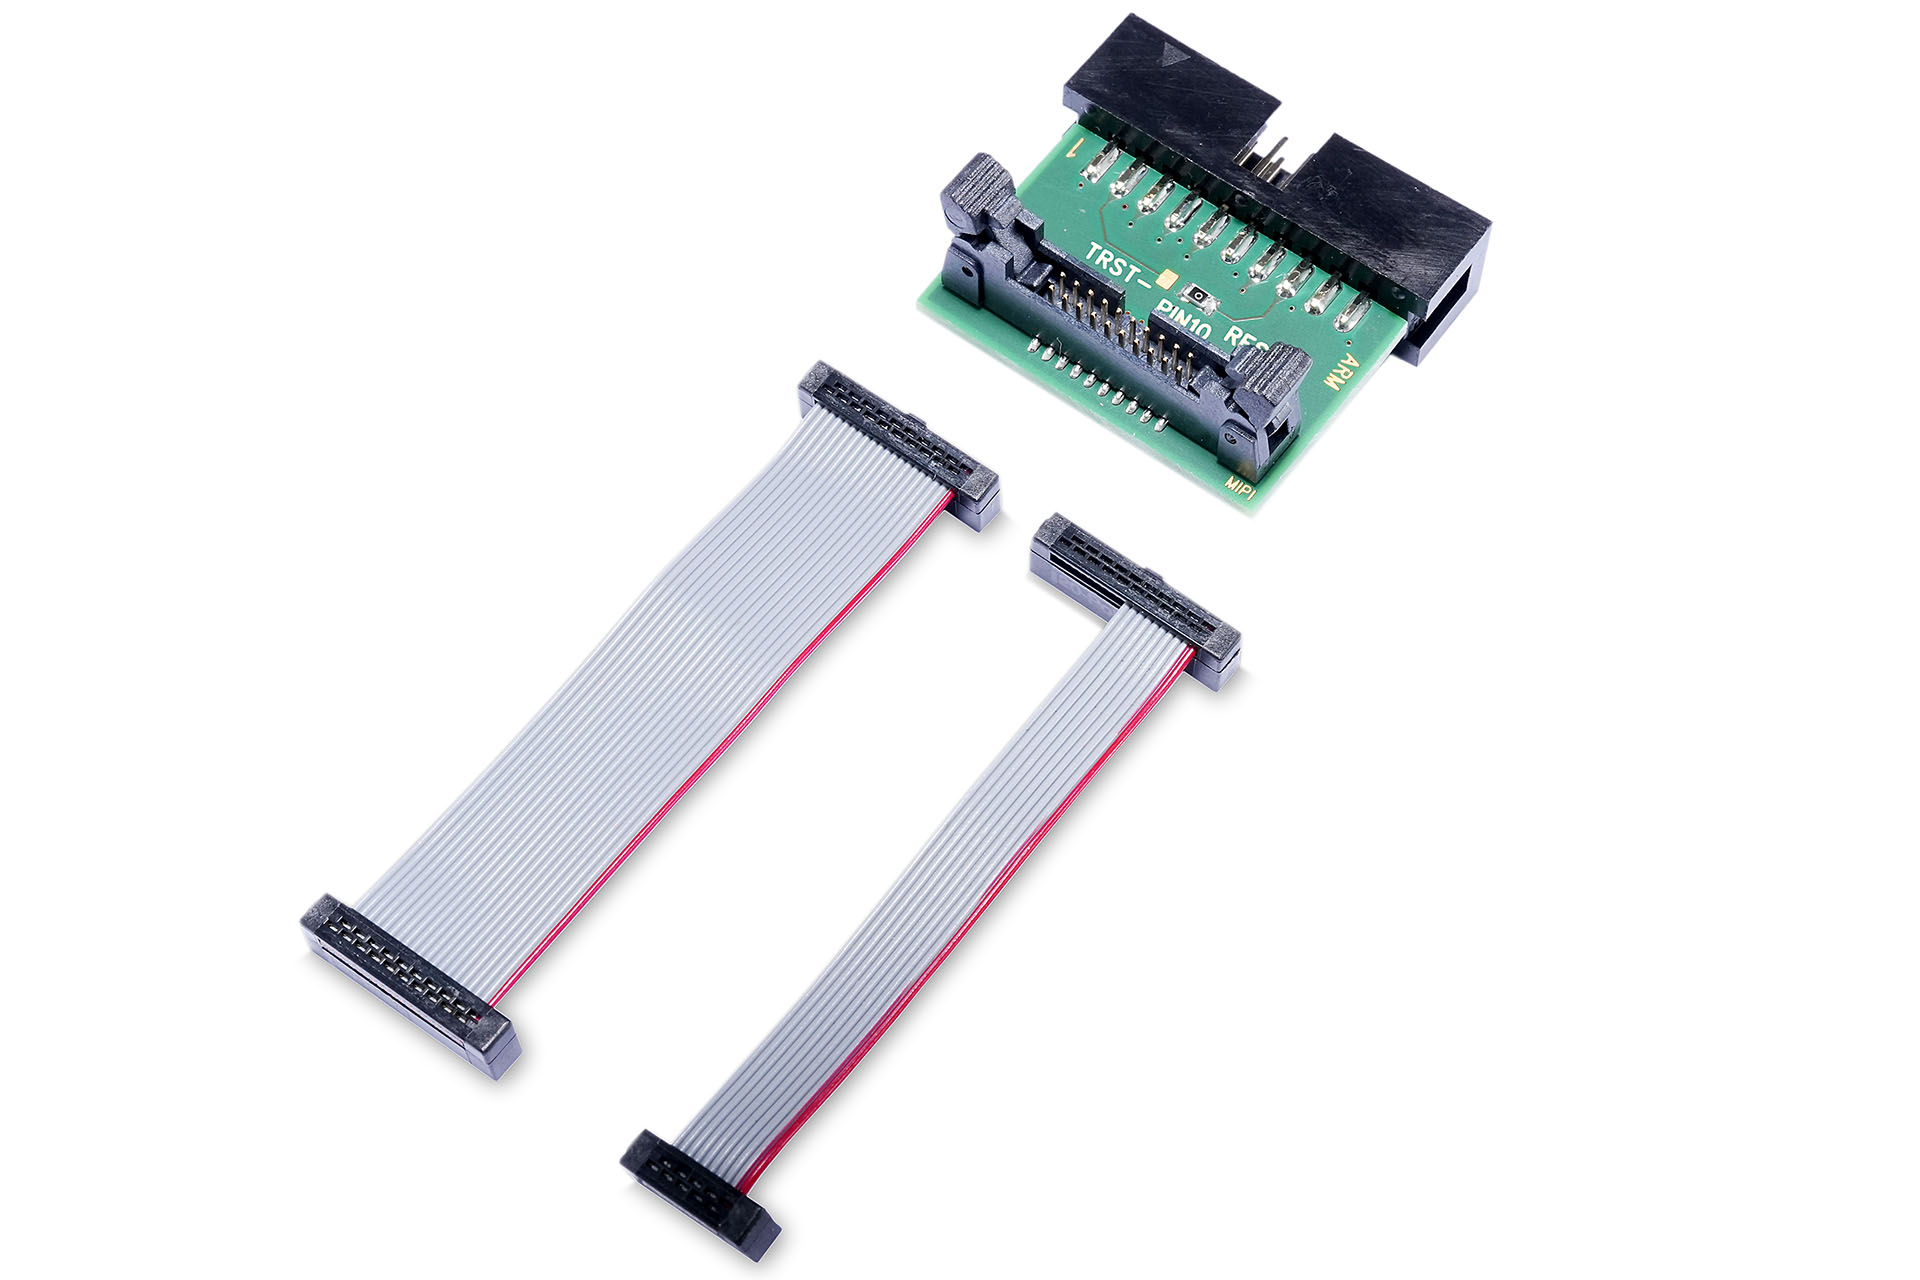
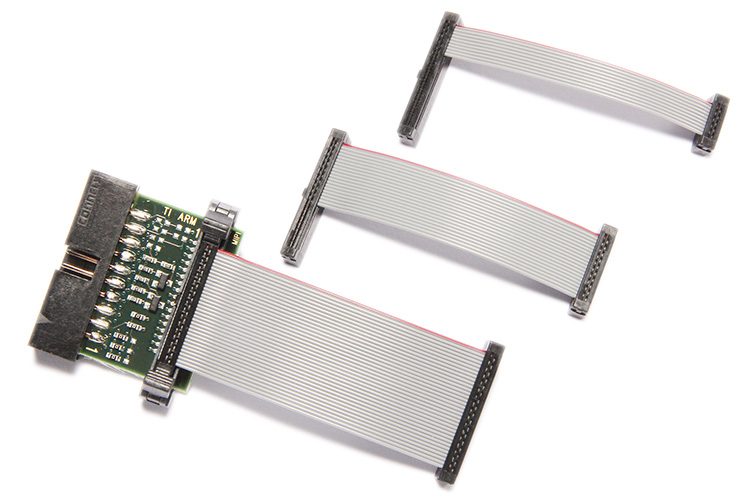
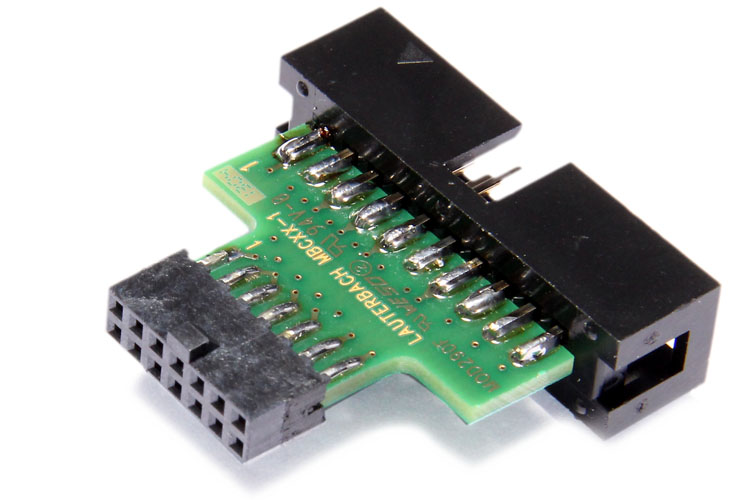
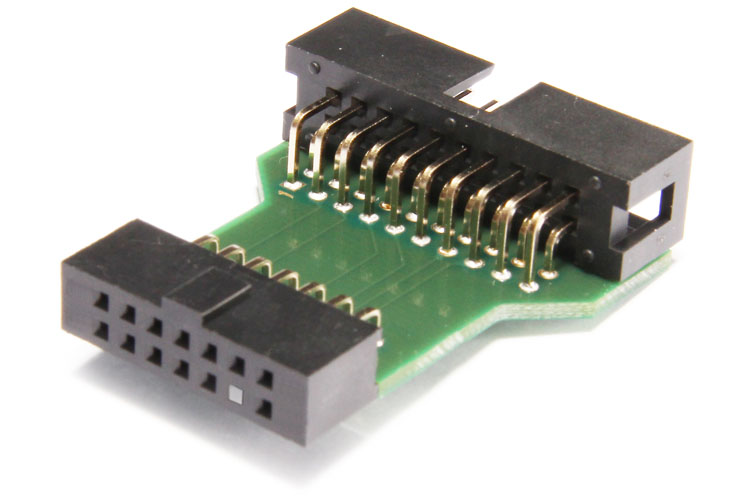
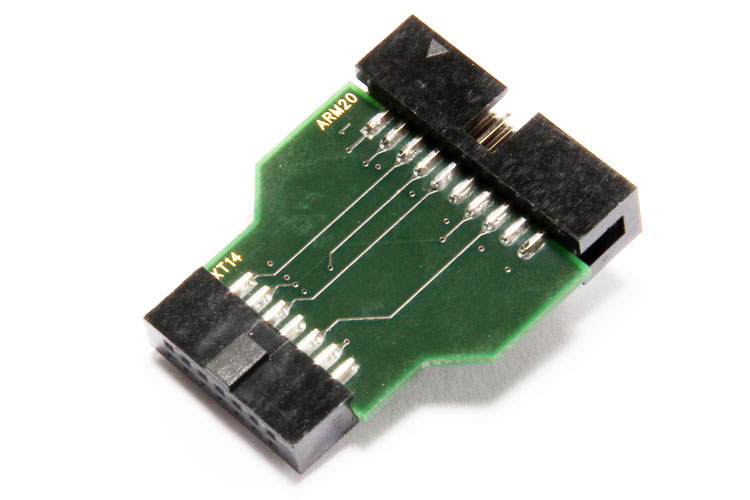
There are many different connectors used in embedded applications. We do have a wide range of converters to adapt to the corresponding connector used.
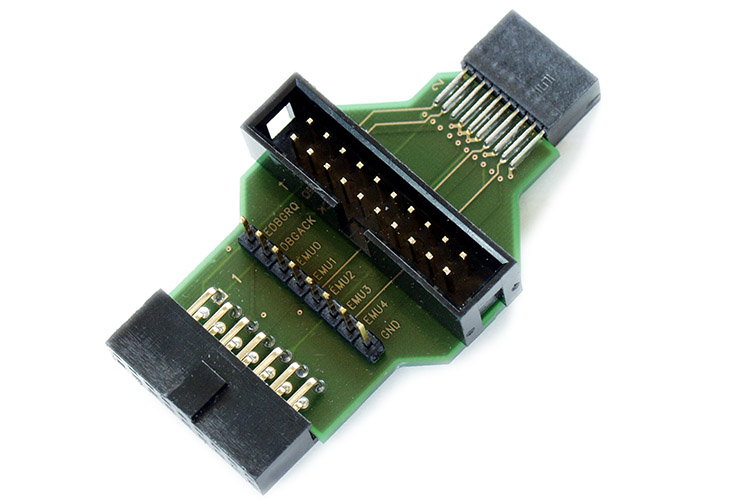
Converter from an IDC20A debug connector to a MIPI10 or MIPI20T connector. It is designed to connect the Lauterbach IDC20A Debug Probe to a MIPI10 or MIPI20T connector on the target. For a board with a MIPI20D connector (with TRST and RTCK) you require converter LA-3770 instead. Find out about the difference between the two converters at https://support.lauterbach.com/kb/articles/la-2729-vs-la-3770 Note: This converter does not connect the trace pins of a CoreSight MIPI20T connector since they are not used by IDC20A debug cables. Whereas tracing via SWO/SWV is supported.
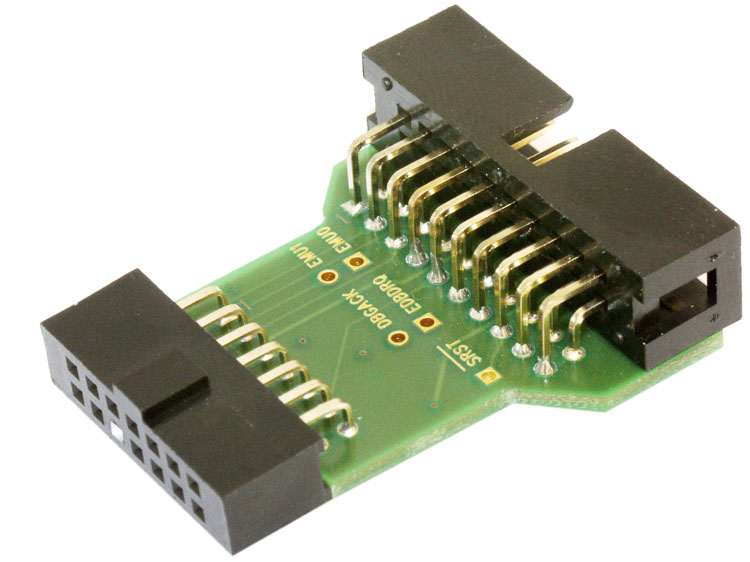
Converter to connect an IDC20A debug cable to a target with MIPI34, MIPI20D, or MIPI10 connector. For connecting an IDC20A debug cable on a PowerTrace Serial use the converter LA-2770 instead. (LA-2770 is for a MIPI34 connector with pin 1 on the right sight, while LA-3770 expects pin 1 on the left side at the target.) For a board with a MIPI20T connector (with pins for off-chip trace) it is recommended to use the LA-2729 converter instead to avoid driver conflicts. Find out about the difference between the two converters at https://support.lauterbach.com/kb/articles/la-2729-vs-la-3770 Alternatively, you can connect to a board with MIPI20T connector by opening J101 and J102 on this converter to avoid driver conflicts, as described at https://repo.lauterbach.com/pdf/app_arm_target_interface.pdf
Converter to connect a Debug Cable to a TI-14 or TI-20-Compact connector which is used on many targets with processors from Texas Instruments
Converter to connect an IDC20A Debug Cable to a TI-14 connector which is used on many targets with processors from Texas Instruments
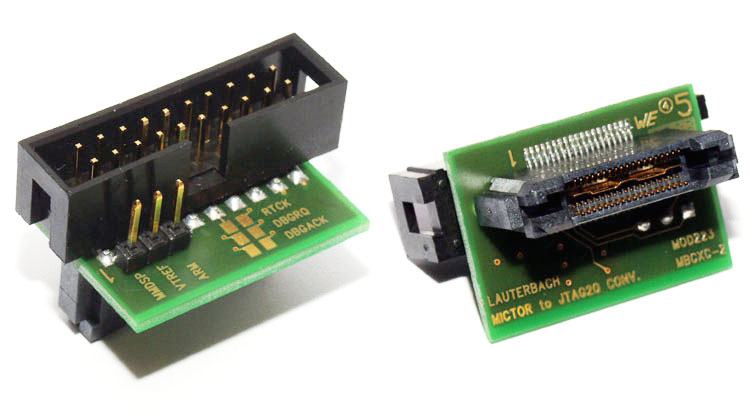
Converter to connect the IDC20A Debug Cable to a Mictor connector on the target providing both debug and trace signals. This is needed if you want to connect the Debug Cable without a Preprocessor and if there is only a Mictor on the target.
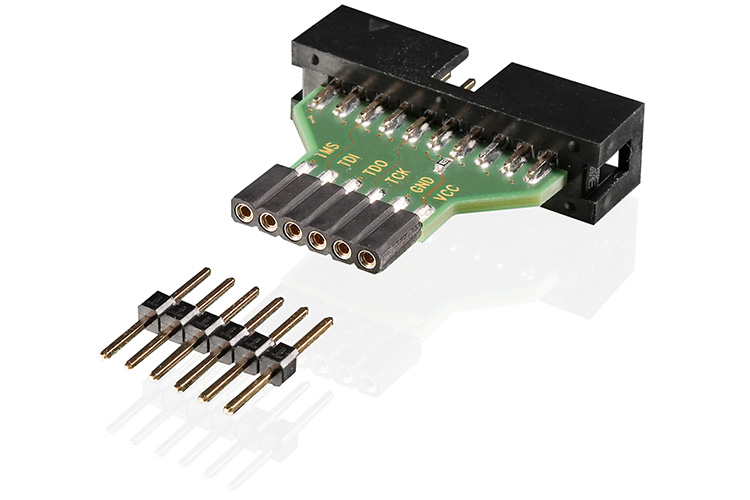
Converter to connect an IDC20A Debug Cable to a standard 6-pin "Pmod™ " connector. “Pmod™” is a trademark of Digilent Inc.
Converter to connect an IDC20A Debug Cable to a 14-pin JTAG connector on Xilinx target boards.
Converter to connect an IDC20A Debug Cable to a MIPS-14 connector on the target
Adapter to connect an IDC20A debug probe to a classic 14 pin debug connector for Xtensa.
Looking For Other Debug Probes
If the IDC20A Debug Probe is not the right solution for you, we offer a various of other debug probes.
Any Questions?
With over 4 decades of industry leadership, our expert engineers are on-hand to help you. If you want advice about our products or which configuration is best for you, please contact our Sales Engineers. If you want help with your Lauterbach system, please contact our Engineering Support Team.


