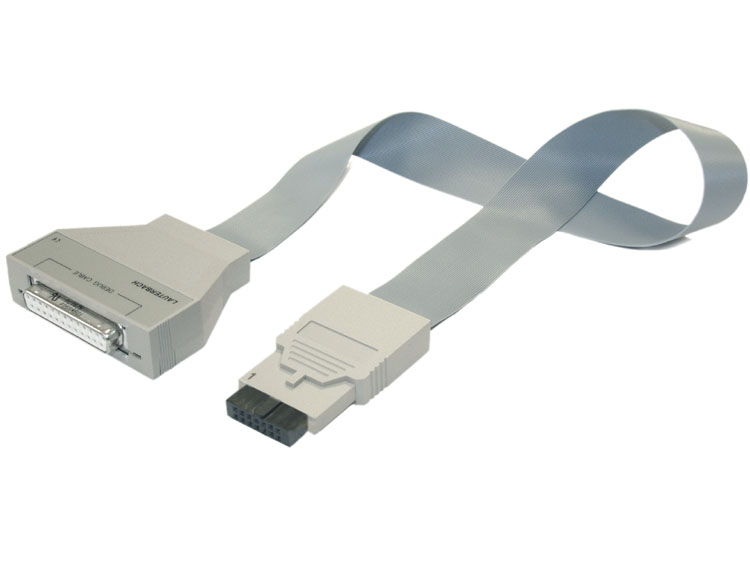
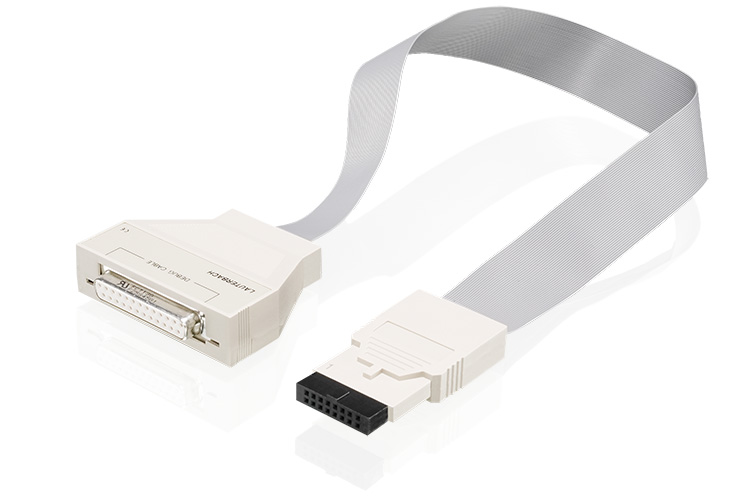
i8051 Debugger
The industry leading TRACE32 Debug system, also available for i8051
From the ground up, Lauterbach tools have always been flexible and modular, allowing for easy expansion or seamless switching between target architectures. This design philosophy has allowed us to create the widest tool support in the embedded industry, all driven from a single User Interface, giving you the maximum return on investment in time and training with our tools. All of our modular tools are driven from a single intuitive user interface, allowing existing users to feel right at home and assuring new users that the skills and knowledge they gain with i8051 can be easily transferred to other, future projects.
On a multicore-SoC, even with multiple architectures, you can debug cores concurrently, empowering you to investigate multi-core interactions of your embedded application. Support is available for many kinds of on-chip and off-chip trace modules, allowing you to expand your debug system with new features and capabilities as you need them. You can be sure that, with our tools, you can extract all the information that your target provides.
These world-class features, together with the powerful script language, which allows even the simultaneous control cores of multiple architectures, give you the debug experience you would expect from the market leader.
Learn more about our debug systemSupported Sub-Architectures
XC800, R8051XC, M8051EW
Which chip do you want to use?
Check out our catalogue of predefined solutions and find the ideal toolset for your project.
3rd Party Tools Supported for i8051
The following features are available for all architectures supported by TRACE32. Please contact us if your device or tool is not listed here; support is often already on its way.


