OS- and Hypervisor-aware Debugging

OVERVIEW

Key Insights into Your Hypervisors, Operating Systems and Applications

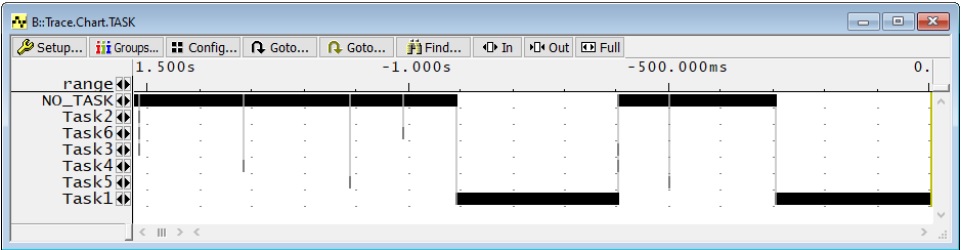
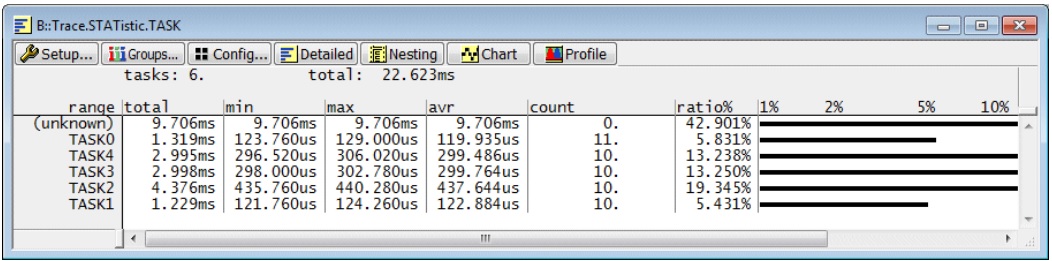
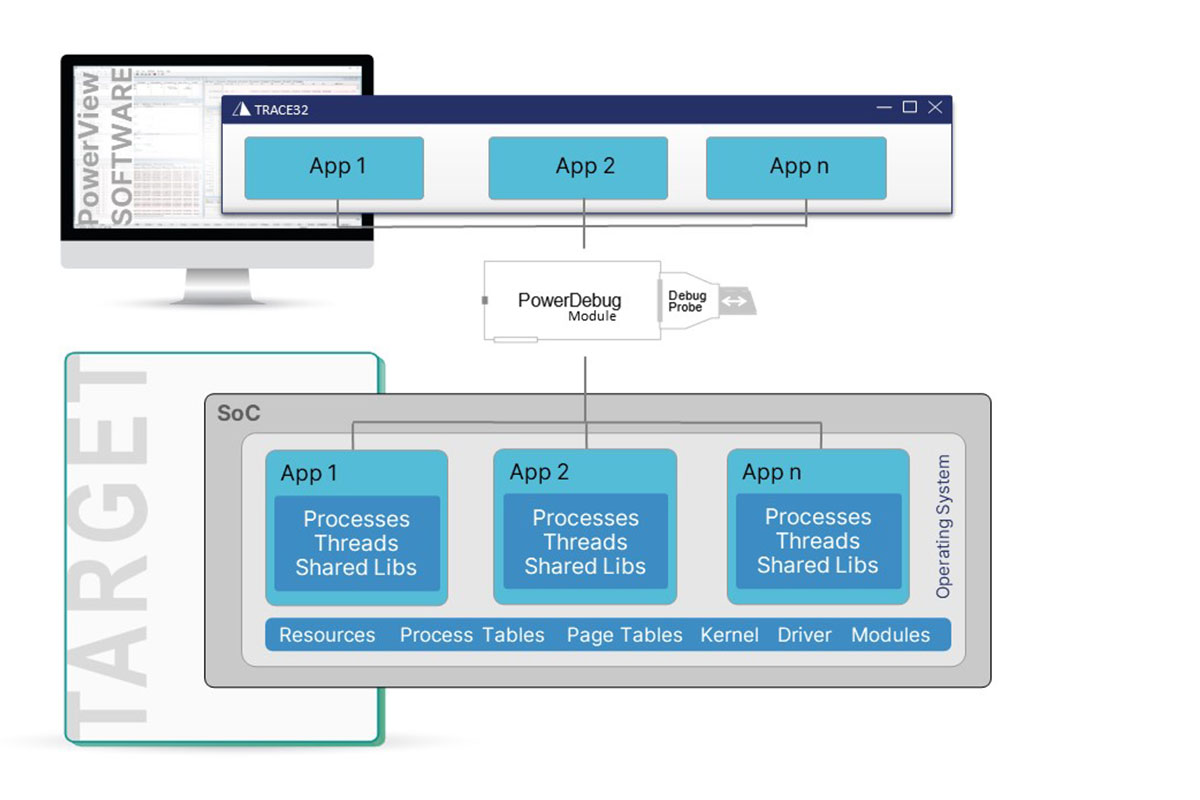
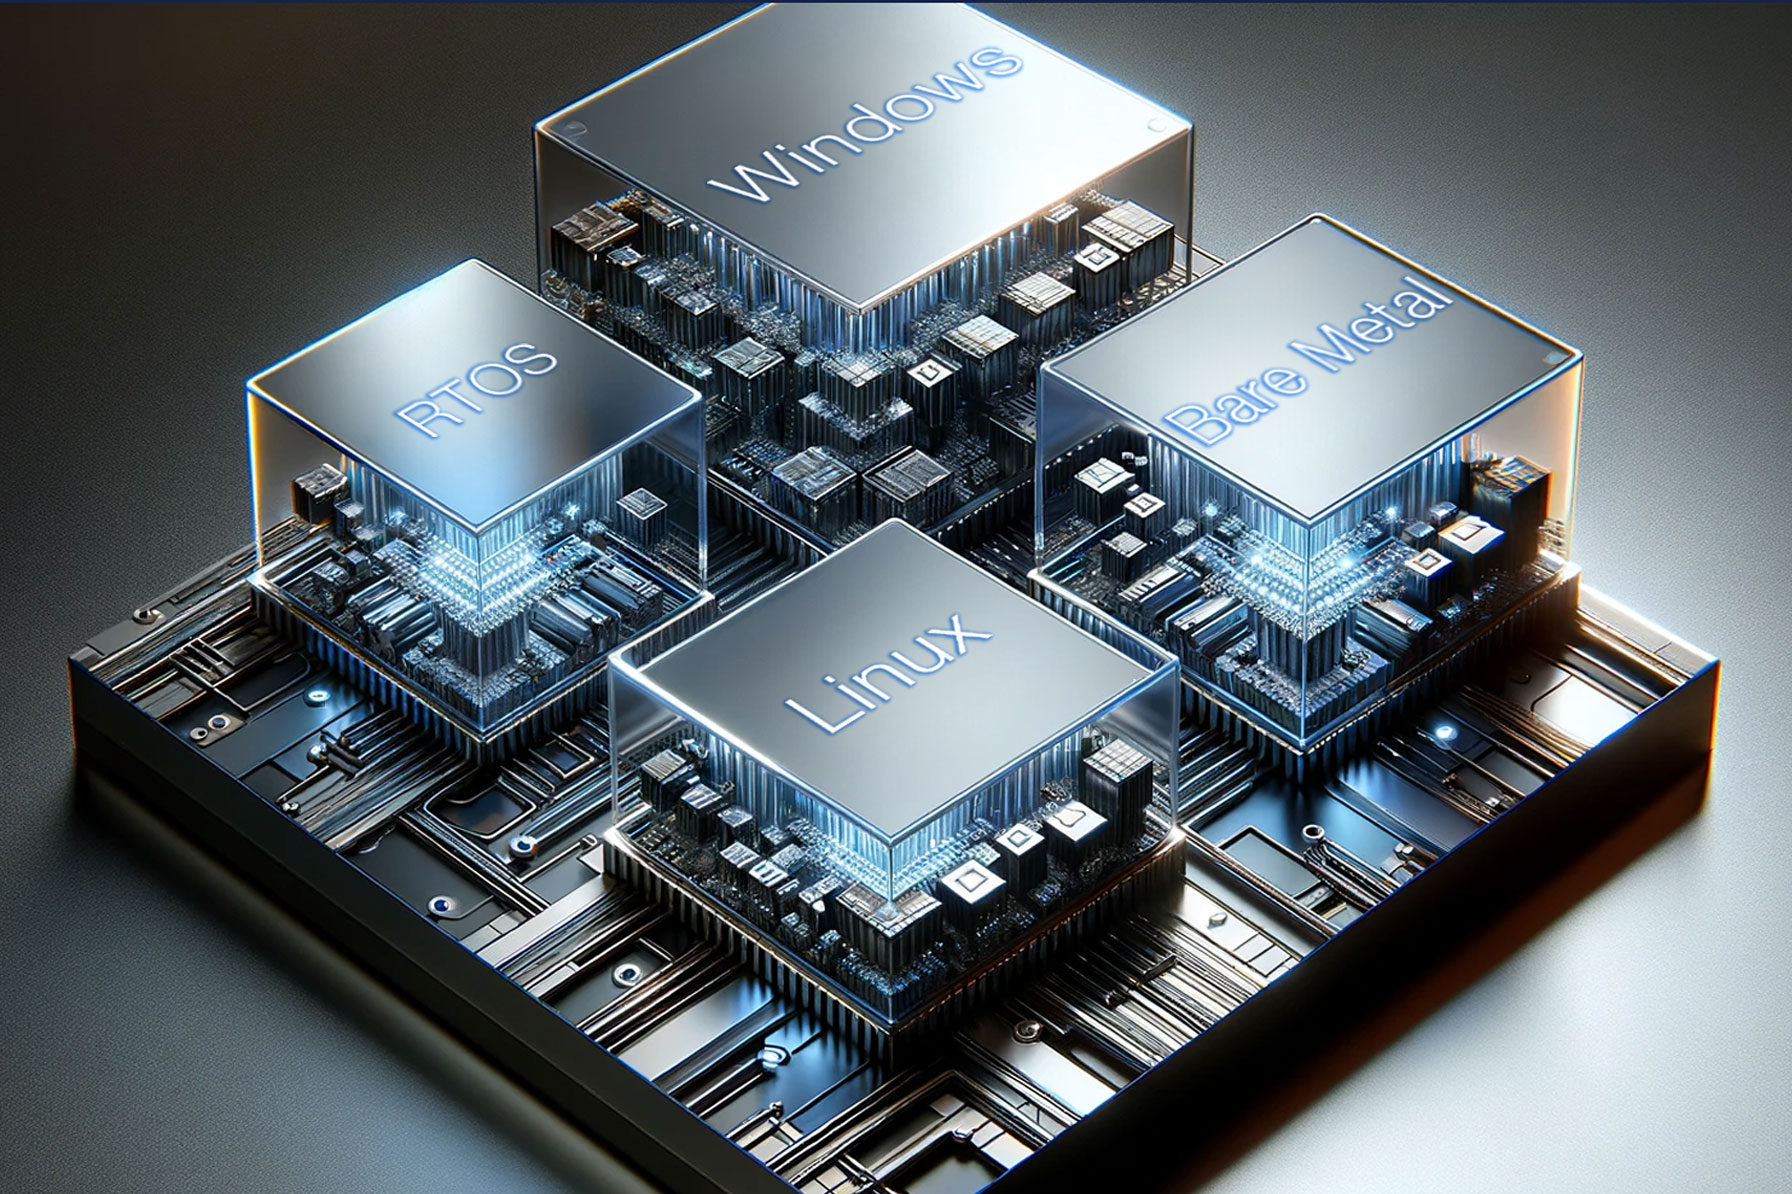
Our TRACE32® OS-aware debugging provides you with several key insights into your applications and the operating systems they are running on, no matter if you use rich operating systems like Linux, real-time Operating Systems (RTOS), industry specific OSes like AUTOSAR-standard based products or a mixture of all.

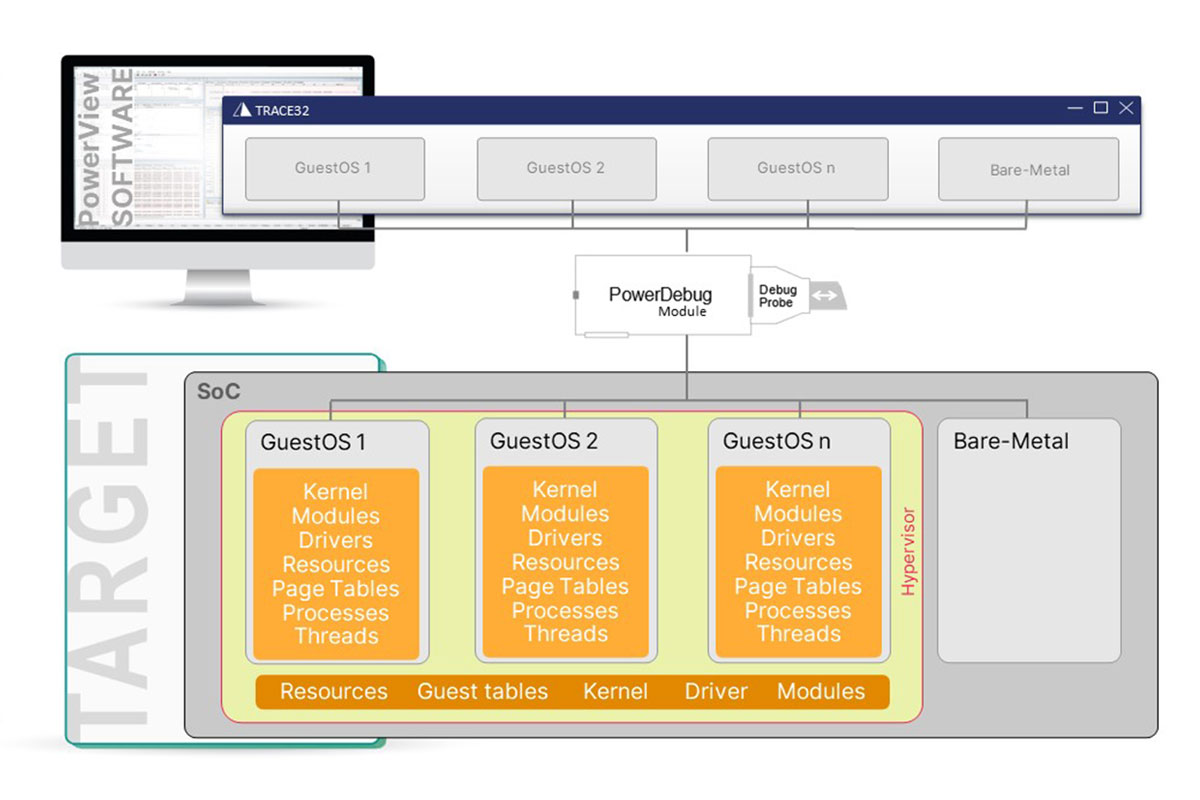
On virtualized systems, where multiple OSes are controlled by a hypervisor, our TRACE32® Hypervisor-aware debugging allows you to perform concurrent OS-aware debugging for each guest OS/virtual ma-chine (VM) and display an overview of the overall system. In addition to static hypervisors we support even dynamic hypervisors, which dynamically allocate memory resources and cores to the VMs, a unique TRACE32® feature in the embedded industry.

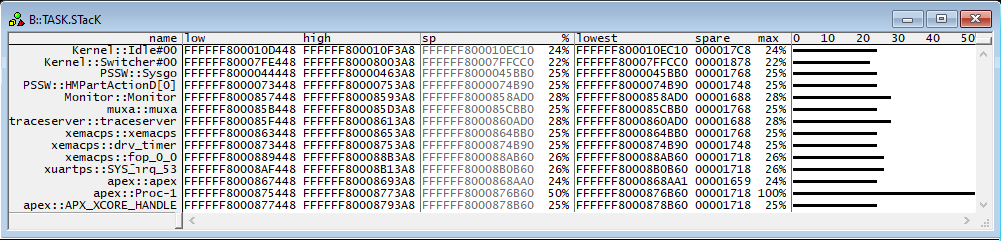
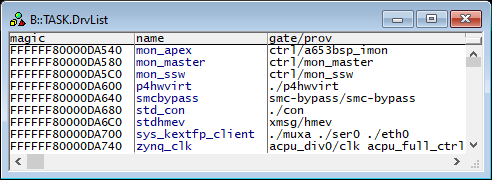
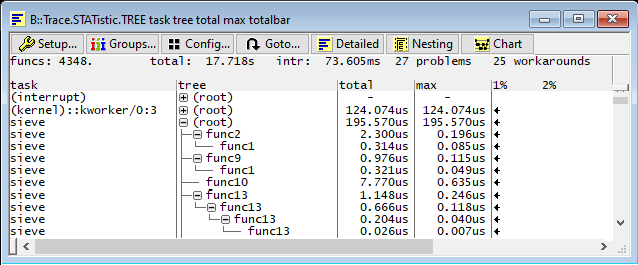
Our TRACE32® tools provide access to hypervisor and OS structures and data so that you can better un-derstand how they are behaving and utilizing chip resources.

Support of more than 80 operating systems

The TRACE32® OS awareness is available for a huge amount of embedded operating systems of all kinds. It supports rich OSes as well as RTOSes and all of the most popular open source and commercial OSes used in embedded applications.

Control over the whole software stack

Debug the whole software stack from user application to device driver and in doing so query and display all OS objects such as threads, message queues, etc. In virtualized systems you can debug all VMs and their applications concurrently.

OS-Aware Tracing & Performance Analysis

Our TRACE32® tools provide many sophisticated real-time analysis functions, including symbolic function call trace and detailed performance analysis functions. They are also available in virtualized systems under control of a hypervisor.

Insights into OS resources

Our TRACE32® tools provides you not only a static display of the current status of OS objects, but also the dynamic behavior of the OS objects over time, e.g. an OS task scheduling analysis.

Debug multiple OS on your multicore SoC

You can debug heterogenous AMP systems with each core running its own (different) Operating System as well as AMP systems with SMP clusters, which share a single OS instance.

Benefit from OS-aware Debugging in virtual & physical targets

TRACE32® PowerView GUI offers you the same debugging experience in simulations as with real hardware. Due to our tool-agnostic concept, you will have the same experience independent of your target – virtual or physical.

FEATURES

Designed to Meet Your Requirements for Any Kind of Embedded System

Our TRACE32® Hypervisor- and OS-awareness technology significantly simplifies your debug activities, as you can immediately access all the components of the Hypervisor, OS and the applications: You can display system objects, such as tasks, threads, semaphores, and mailboxes, set task-aware breakpoints and perform task-aware performance monitoring. If your OS uses an MMU (Memory Management Unit), our debugger can access code and data using the information from the OS MMU tables and walk through it to find a valid logical-to-physical translation.

The availability of the individual features depends on the specifications of the chip used and your TRACE32® products. Learn more about it in the slides below.

Display Task List

Displays the task table of an OS or detailed information about one specific task.

The Global Task List represents the heart of the TRACE32® hypervisor-aware debugging. It lists all tasks/processes/threads of the guest OSes and the hypervisor. PowerView can visualize the context of any task in its GUI, even if a VM is currently not active.

Display Stack Usage

For stack usage coverage of tasks, this window displays all active tasks with its stack pointer addresses, maximum stack usage, stack area and stack utilization.

Display Kernel Objects and Logs

Depending on the used OS(es) you can display various kernel resources, e.g. Processes, Threads, Queues, Semaphores, Timers, Event Groups, Stream Buffers, Message Buffers, Kernel Driver or Kernel log buffers.

Task Activity Time Chart

Displays a task runtime time chart with the time spent in different tasks. You can see how much time is spent in the critical paths of the program and easily identify challenges caused by interrupts or task prioritization.

Task Performance Analysis

Here you can analyze task run-times. This includes the total run-time of a task with its CPU utilization, the count, how often the task was scheduled, and the shortest, longest and average time the task was scheduled.

Nested Function Runtime Analysis

Display of a graphical tree of the function nesting. The minimum, maximum, average and total runtime of functions is displayed as well as the number of runs and the proportion of the total execution time.

Virtual Task Switches and View into Kernel Stacks

Display of the call stack of the operating system, libraries and the application, including local data storage, parameter passing, enclosing subroutine and block context, and return states. This is useful to analyze the context of any process, and to examine the current state of a thread. The call stack shows clearly, if and where the application waits for a specific OS event.

Code Coverage for Complete System including Operating System(s)

Displays the result of the code coverage analysis related to modules including OS code. You can analyze several code coverage metrics and also display results for the selected metric and all included metrics. E.g. the MC/DC metric includes also Condition, Decision and Statement coverage.

How it works

Debugging the Overall System with or without Hypervisor

Debugging an operating system requires special support from the debugger. We say that the debugger needs to be “aware” of the operating system. Since our TRACE32® debug- and trace tools support a wide range of target operating systems, this special support is not statically linked in the debugger software but can be dynamically loaded as an extension depending on which operating system is used.

The set of files providing operating system debugging capabilities is called “awareness”. To be able to read the task list or to allow process or module debugging, the OS awareness accesses the OS kernel’s internal structures using the kernel symbols. The TRACE32 OS-awareness and the TRACE32 MMU support allow users to debug seamlessly across process boundaries: It is possible to directly access the virtual address space of each process and to display the current register set and the stack frame for every single process. After loading an OS specific extension, our TRACE32® PowerView software provides additional commands, options and displays, which simplify the debugging of the operating system.

The virtualization concept allows multiple operating systems to be run in parallel on a single hardware platform. A hypervisor, which is the core of virtualization, ensures that everything works reliably and efficiently. The hypervisor is a software layer fulfilling two tasks: Starting and managing the virtual machines (VMs) and virtualizing the physical hardware resources for the VMs. An operating system running within a VM is referred to as a guest OS. All accesses by the guests to the virtualized hardware resources are mapped to the physical resources by the hypervisor.

Using our TRACE32® hypervisor-awareness, the debugger detects and visualizes the VMs of the hypervisor. it is now possible to debug several operating systems at the same time. The most important objective is seamless debugging of the overall system. This means that when the system has stopped at a breakpoint, you can check and change the current state of every single process, all VMs, plus the current state of the hypervisor and of the real hardware platform. In addition, you can set a program breakpoint at any location in the code.


SUPPORT FOR AUTOSAR

Debug, Trace and Profile AUTOSAR-Based Automotive Systems

For AUTOSAR-based, safety-critical (multicore) microcontroller/microprocessor systems in the automotive industry, advanced analysis techniques are required to prove functional safety. Our TRACE32® debug and trace tools not only enable deep insights into such systems thanks to our TRACE32® AUTOSAR OS awareness, but also advanced timing analysis solutions as a result of our long-standing cooperation with the most important AUTOSAR tool vendors.


SUPPORTED OS

Support of Any Popular OS Used in Embedded Applications

TRACE32® supports all popular open source and commercial real-time and rich operating systems used in embedded applications and over 80 operating systems in total.

Most Popular OSes

  • FreeRTOS

    Our TRACE32® software package contains a ready-to-run configuration for the FreeRTOS Real Time Kernel. The FreeRTOS awareness provides easy access to task lists and other kernel information, generates performance analysis data and enables you to do a most effective debugging with the TRACE32® systems on targets running FreeRTOS.

    Learn more
  • Linux

    Our TRACE32® software package contains a ready-to-run configuration for the Linux operating system. The Linux awareness provides easy access to task lists and other kernel information, generates performance analysis data and enables you to do a most effective debugging with the TRACE32® systems on targets running Linux.

    Learn more
  • PikeOS/PikeOS MPU

    Our TRACE32® software package contains a ready-to-run configuration for the PikeOS Real Time Operating System from SYSGO AG. The PikeOS awareness provides easy access to task lists and other kernel information, generates performance analysis data and enables you to do a most effective debugging with the TRACE32® systems on targets running PikeOS or PikeOS MPU.

    Learn more
  • QNX

    Our TRACE32® software package contains a ready-to-run configuration for the QNX Real Time Kernel from BlackBerry Limited. In close cooperation with BlackBerry, we built a high sophisticated QNX awareness, which enables you to do a most effective debugging with the TRACE32® systems on targets running QNX.

    Learn more
  • VxWorks

    Our TRACE32® software package contains a ready-to-run configuration for the VxWorks real-time kernel from Wind River. In close cooperation with Wind River, we built a high sophisticated VxWorks awareness, which enables you to do a most effective debugging with the TRACE32® systems on targets running VxWorks.

    Learn more
  • Zephyr OS

    Our TRACE32® software package contains a ready-to-run configuration for the open-source ZephyrOS Real Time Operating System. The ZephyrOS awareness provides easy access to task lists and other kernel information, generates performance analysis data and enables you to do a most effective debugging with the TRACE32® systems on targets running ZephyrOS.

Here you will find each of the more than 80 supported operating systems.

Find Your Target OS
SUPPORTED HYPERVISORS

Support of the Widest Range of Hypervisors Used in Embedded Applications

TRACE32® supports a wide range of open source and commercial static and dynamic hypervisors in embedded applications. Static hypervisors partition resources statically and assign them at system instantiation time, wheras dynamic hypervisors allocate the resources dynamically to a VM. Memory is usually assigned to a VM using a 2-stage translation performed by a MPU or MMU. Support for dynamic hypervisors is a unique feature of our TRACE32® tools in the embedded industry.


Custom and Confidential OS

Develop Your own OS Awareness for Custom and Confidential OS

Even for operating systems for which we cannot provide out-of-the-box-support for OS-aware Debugging, e.g. for reasons of confidentiality, you can use our TRACE32® tools without having to do without this functionality.

Our TRACE32® PowerView GUI provides a mechanism to add customized features, called Extensions. In an Exten-sion you can call API functions to implement a wide variety of features, including display (RT)OS kernel resources (e.g. task lists), perform task aware statistical analysis or perform task specific stack coverage.

By doing this you can implement OS-aware Debugging for your own operating systems easily. All necessary tools to build an extension are included in our Extension Development Kit (EDK), which is available free of charge for TRACE32® customers on request.