Multicore Debugging & Tracing

OVERVIEW

Unlimited Multicore Debugging for Even Your Most Complex Chips

System-on-Chip (SoC) is the brain behind computing and communication in a wide variety of electronic systems. As applications grow increasingly complex, so do the SoCs that power them. Not only is the number of cores constantly growing, but also the number of different core. With TRACE32®, you can debug and trace even your most complex SoCs, including your applications, operating systems, hypervisors, and other software running on multiple cores. In Summary, TRACE32® provides you with the deepest possible insights into your entire embedded system.

Debug Mixtures of More than 150 Supported Core Architectures

Debug cores from different architectures simultaneously via one debug interface and one debug probe to gain insight into your entire embedded system.

Perform Concurrent and Synchronous Debugging with AMP

Debug cores from different architectures simultaneously with synchronous run-control of all cores in AMP systems.

Manage Complex Systems Running Multiple OS and Hypervisors

For getting insights into your entire embedded system, debug not only their applications but also multiple operating systems and hypervisors.

Explore Heterogeneous Multichip Systems

Debug complex embedded systems that consist of two or more SoCs, each of them can have several identical or different cores implemented.

Simplify Debugging of Manycore Systems

Use our self-invented iAMP approach (Integrated Asymmetric MultiProcessing) to debug an SMP capable CPU cluster in one GUI with synchronous run-control of all cores.

Trace Heterogenous and Homogeneous Multicore Systems in Realtime

Record traces from multiple cores simultaneously over the same trace port using a mix of heterogeneous or homogeneous processor architectures.

Multicore Debugging

Seamless Debugging of Any Multicore System

No matter what kind of multicore system you use, TRACE32® supports them all. Whether Symmetric Multiprocessing (SMP), Asymmetric Multiprocessing (AMP), Integrated Asymmetric MultiProcessing (iAMP), mixed AMP/SMP- and multi-chip-systems, or manycore architectures with over 1 000 cores, it doesn't matter. Our PowerView software with all it’s industry leading features remains your unified user interface for all chips and all cores.

Heterogenous Multicore Systems

AMP systems have multiple cores, each of which fulfills a separate task. Our PowerView software provides you with a consistent GUI and feature set for any mixture of Core architectures. You can debug all kinds of multicore configurations with up to 16 synchronized PowerView instances via a single debug probe.

  • Heterogenous AMP Systems
    Within your system, each core may have its own core architectures, memory model, Operating System, address translation, and debug symbols as well as its own physical address space.
  • Multi-Chip AMP Systems
    Some embedded control units contain several separate multicore SoCs. You can combine them for debugging via a daisy-chain (JTAG), a star topology (cJTAG/SWD) or by using two whiskers with a CombiProbe.
  • Combined AMP/SMP Systems
    Multicore SoCs often contain an SMP cluster of identical high-performance application cores surrounded by a mix of cores with other CPU architectures for dedicated tasks.

Homogenous Multicore Systems

SMP systems have multiple cores serving a common goal, where all cores have exactly the same core architecture. Our PowerView software can debug all cores in one GUI, with or without operating systems or hypervisors, from 2 to 1 024 cores. You can start and stop all cores simultaneously - or focus on just one core.

  • SMP Cores as OS Resources
    In an SMP system, you can consider the CPU cores as execution resources of the target operating system. The focus of debugging is on the tasks being executed in parallel, rather than which core is actually executing which task.
  • Arm® DynamIQ Shared Unit (big.LITTLE)
    In a single PowerView GUI you can debug an SMP system with DynamIQ. DynamIQ combines high-perfomance cores with power-efficient cores allowing the operating system to power-down those cores not currently required to save energy.
  • Hypervisors Orchestrating Multiple OSes
    Today's SMP multicore clusters are often used by more than one operating system at a time, with a hypervisor protecting the physical memory. PowerView is at your side to debug even these most complex systems.

Manycore Systems

Manycore systems, known from high-performance computing, are a special form of multicore system and are typified by running multiple operating systems. The iAMP we invented now allows identical, logically coupled cores to be debugged via a single PowerView GUI instance with synchronous run-control of all cores.

  • Massive Multicore Debugging in a Single GUI
    Even without a Hypervisor, PowerView allows you to group identical cores logically into machines, each with its own target operating system.
  • iAMP Systems with SMP Clusters
    iAMP allows you to group up to 1 024 cores into up to 30 virtual machines, where a machine can be an individual core or an SMP subsystem.


SMP

AMP

iAMP

Debug homogeneous cores*

Debug heterogeneous cores


Debug all cores in one PowerView GUI


Debug cores in multiple PowerView GUIs**


Use hypervisor with statically assigned guests

Use hypervisor with dynamic core assignment


Use a single OS that manages multiple cores


Use multiple OSes


Synchronous run

Asynchronous run


*: Identical cores or at least Cores of the same Instruction Set.

**: Up to 16.

Find the Ideal Debug Mode for Your Needs

If you want to create a new TRACE32® setup for any multicore system, you can choose between SMP, AMP, and our self-invented iAMP. While the table gives you a quick overview of the most important use cases, you’ll find descriptions of possible configurations in the detail above.


SMP

AMP

iAMP

Debug Homogeneous Cores*

Debug Heterogeneous Cores


Debug all Cores in one PowerView GUI


Debug Cores in multiple PowerView GUIs**


Use Hypervisor with statically assigned guests

Use Hypervisor with dynamic core assignment


Use a single OS that manages multiple cores


Use multiple OSes


Synchronous run

Asynchronous run


*: Identical Cores or at least Cores of the same Instruction Set.

**: Up to 16.

MULTICORE DEBUG CONFIGURATIONS FOR iAMP SYSTEMS

One Single Debugger for All Cores of a Manycore System

Manycore systems are a special form of multicore system and are typified by running multiple operating systems. Such systems, which were previously used primarily in the area of high-performance computing, are now increasingly being used for embedded designs. The iAMP we invented now allows identical, logically coupled cores to be debugged via a single PowerView GUI instance with synchronous run-control of all cores.

Multicore Off-Chip Tracing

Perform Multi-Core Off-Chip Tracing in AMP, iAMP or SMP systems

In this example, you trace each SMP subsystem and individual core from its own PowerView GUI and can use up to 16 PowerView GUIs. PowerView starts and stops each SMP subsystem and individual core independently, but they can also be synchronized. An Off-Chip-Trace configuration like this is ideal when:

  • You want to benefit from the very large trace buffers in our TRACE32® PowerTrace modules to collect trace information for a long period, which is essential e.g. for Code Coverage and Timing analysis, but also for many troubleshooting scenarios.
  • You do not want to have to stop the target periodically to read out the trace information of a small on-chip trace buffer and transfer it to the Host-PC before you can continue tracing.
  • There is no sufficient On-Chip Trace buffer (or a Trace buffer with insufficient size according to your needs) implemented.
  • You want to stream trace data to your Host-PC with maximum bandwidth.
Multicore Tracing

Analyze the Real-Time Behavior of All Cores Concurrently

Sometimes traditional Stop-Mode-Debugging may be not sufficient. Program flow data provided by our Trace extensions shows you exactly which instructions have been executed and how long it took to execute them, without interfering with the application being tested. This is useful e.g. to locate hard-to-find bugs that only occur at run-time, to ensure that your application meets all timing requirements, or to create code coverage reports for certification.

With our trace tools, you can capture real-time traces on any multicore SoC that provides a trace interface or on-chip buffer. It doesn't matter what type of multi-core system you are using: Symmetric Multiprocessing (SMP), Asymmetric Multiprocessing (AMP), Integrated Asymmetric Multiprocessing (iAMP), or any kind of mix. Modern multi-core SoC merge the trace data from all cores, so you only need a single trace probe to capture the off-chip trace of all cores all together.

Multi-Core Off-Chip Tracing

Off-Chip-Trace is ideal when:

  • You want to find Heisenbugs, which appear only in real-time. If the bug occurs only occasionally or has complex causes, you might want to record over a long period of time.
  • You want Code Coverage and Timing Analysis, which requires the collection of trace information over a long period of time. A long recording is assured with the large trace buffers provided in our TRACE32® PowerTrace modules.
  • You want to stream trace data to your Host-PC to see Code Coverage results in real-time, or to capture extremely long trace recordings for very comprehensive analysis.
  • Stopping the target periodically is not an option for you. Therefore, transferring a small on-chip trace buffer to the host-PC is out of the question You need a large off-chip trace buffer.
  • There is no sufficient On-Chip trace buffer implemented (or a trace buffer with insufficient size to satisfy to your needs.

Multi-Core On-Chip Tracing

On-Chip-Trace is ideal when:

  • You want to find Heisenbugs, which appear only in real-time.
  • The size-limited on-chip trace buffer is sufficient to collect the necessary trace information for your trouble-shooting scenarios.
  • You don’t have to perform real-time tracing for a longer period of time.
  • You don’t need Code Coverage and Timing Analysis.
  • The chip is limited to a debug port and has not implemented a separate trace port.
DEBUG AND TRACE POPULAR MULTICORE SOCs

Our Tools Cover Them All

Our TRACE32® Debug- and Trace tools cover all popular available multicore SoCs. In this section you find seven examples of very successful and complex SoCs from different and well-known chip manufacturers - and your ideal TRACE32® configuration to debug and trace them easily and quickly.

Debug and Trace AMD Zynq™ UltraScale+™ MPSoC

Heterogeneous Multiprocessing Platform for Broad Range of Embedded Applications.

Implements:

  • 4 x Application Cores Arm® Cortex®-A53
  • 2 x Real-Time Cores Arm® Cortex®-R5F.
  • 1 x Platform Management Unit MicroBlaze Hard-IP.
  • Optional Arm® Cortex®-M3, Cortex®-M1 and MicroBlaze Soft-Cores in the FPGA Logic.

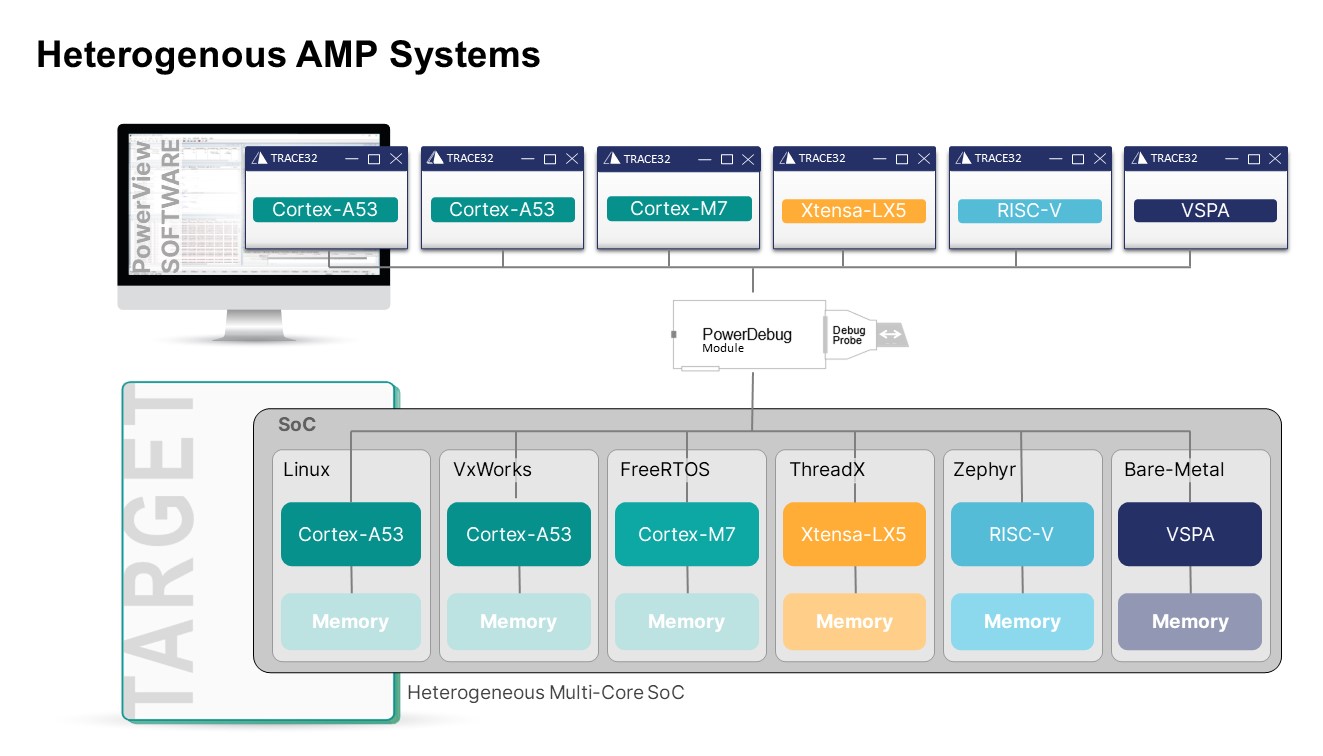
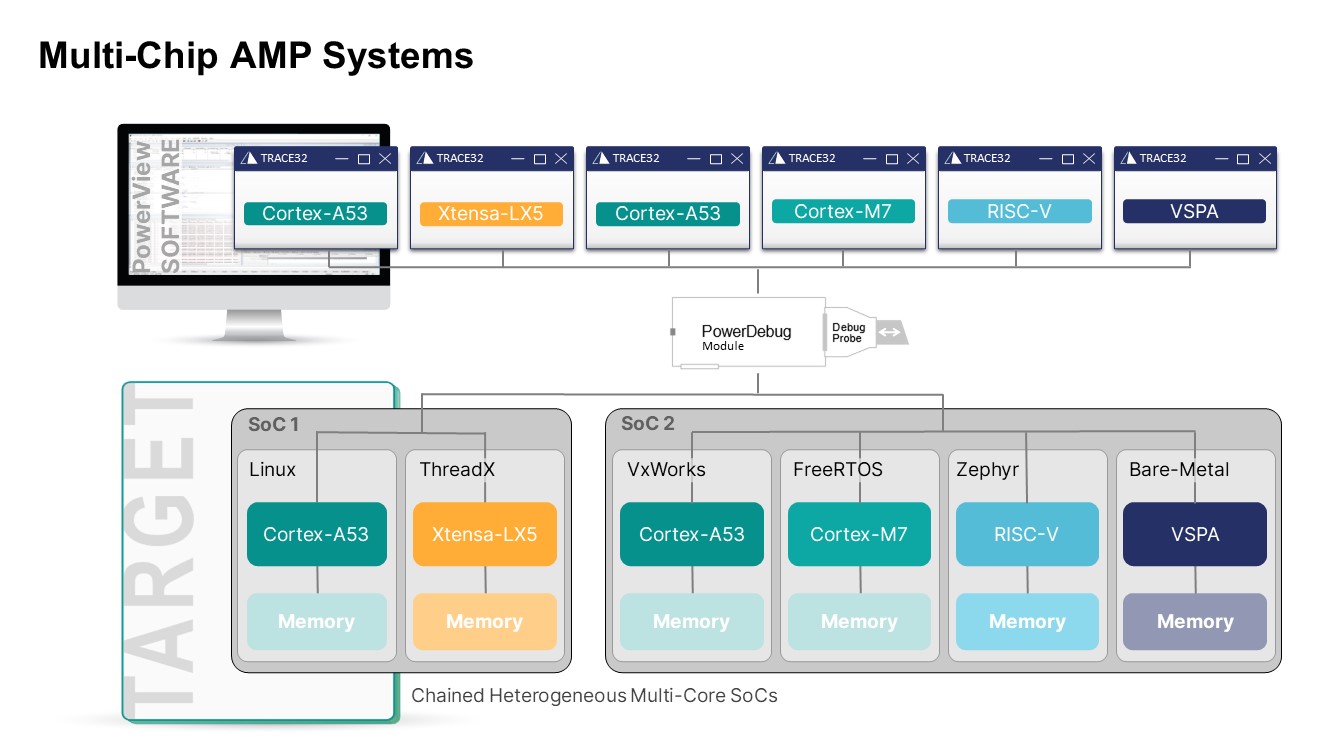
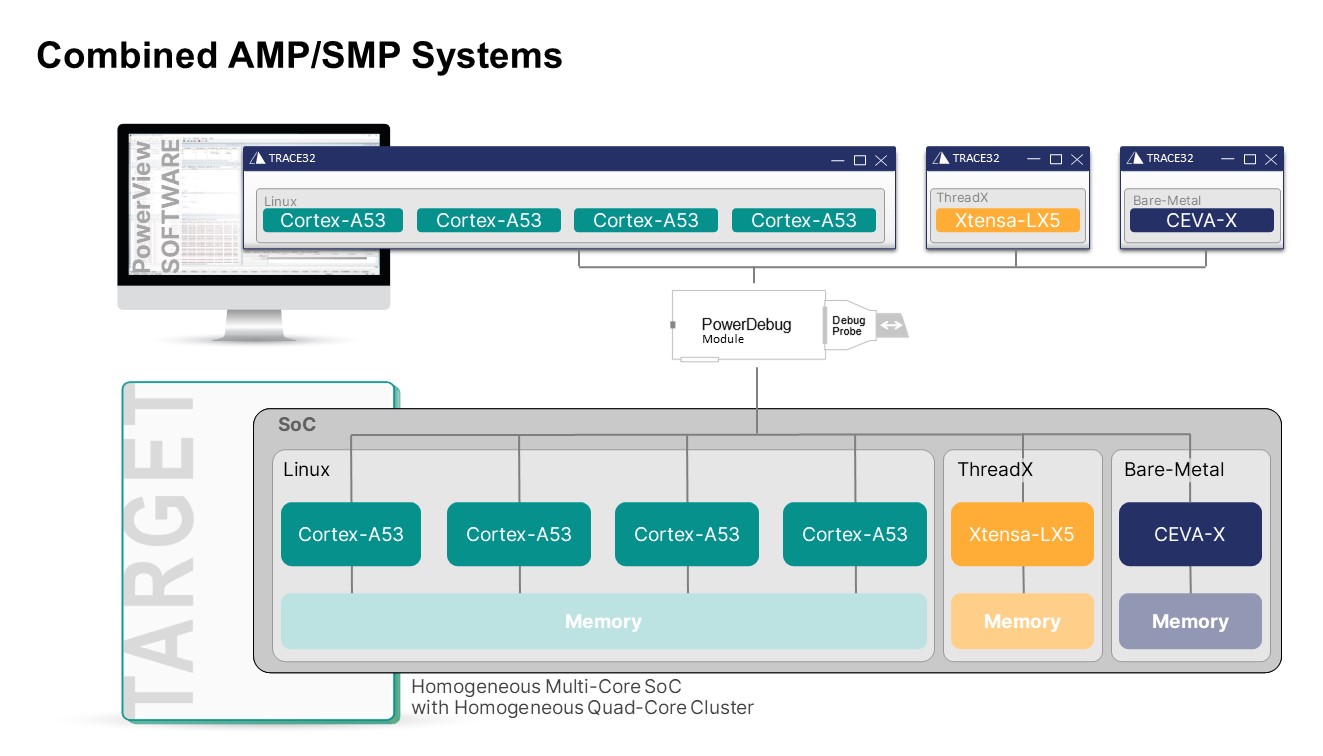
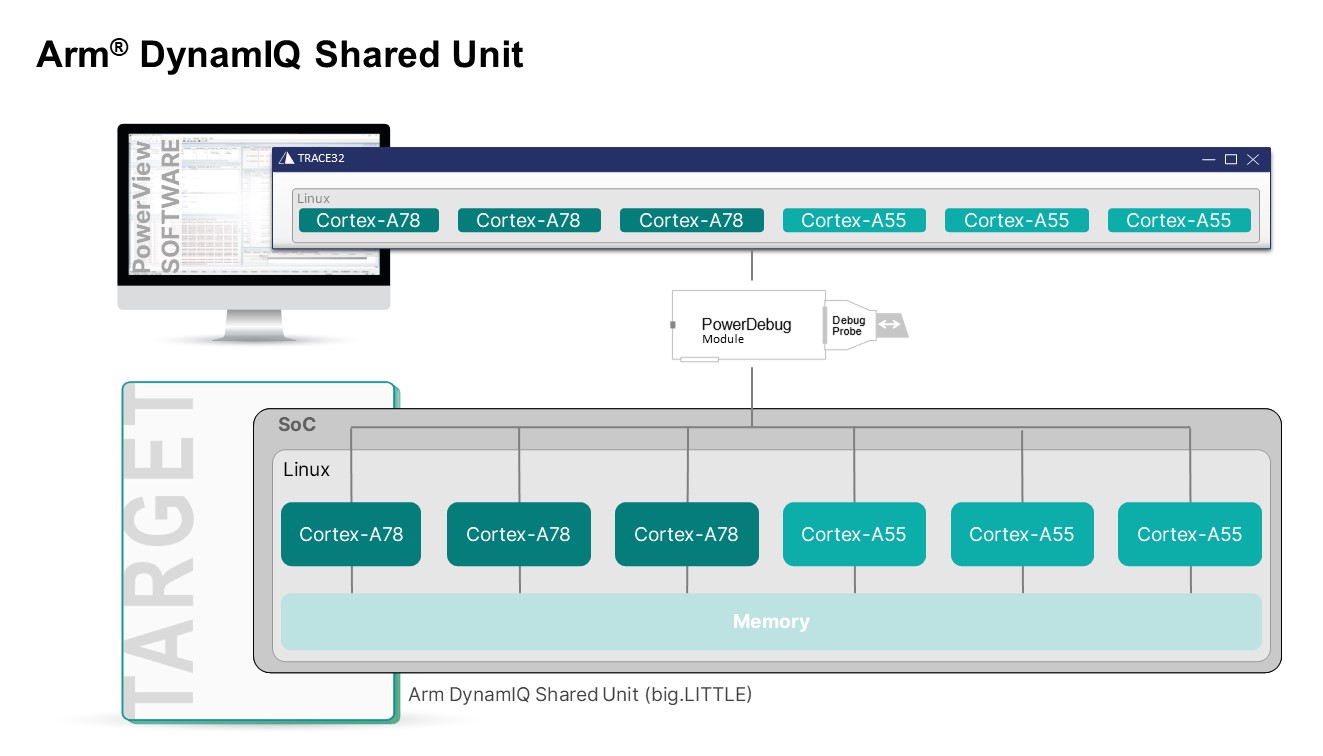
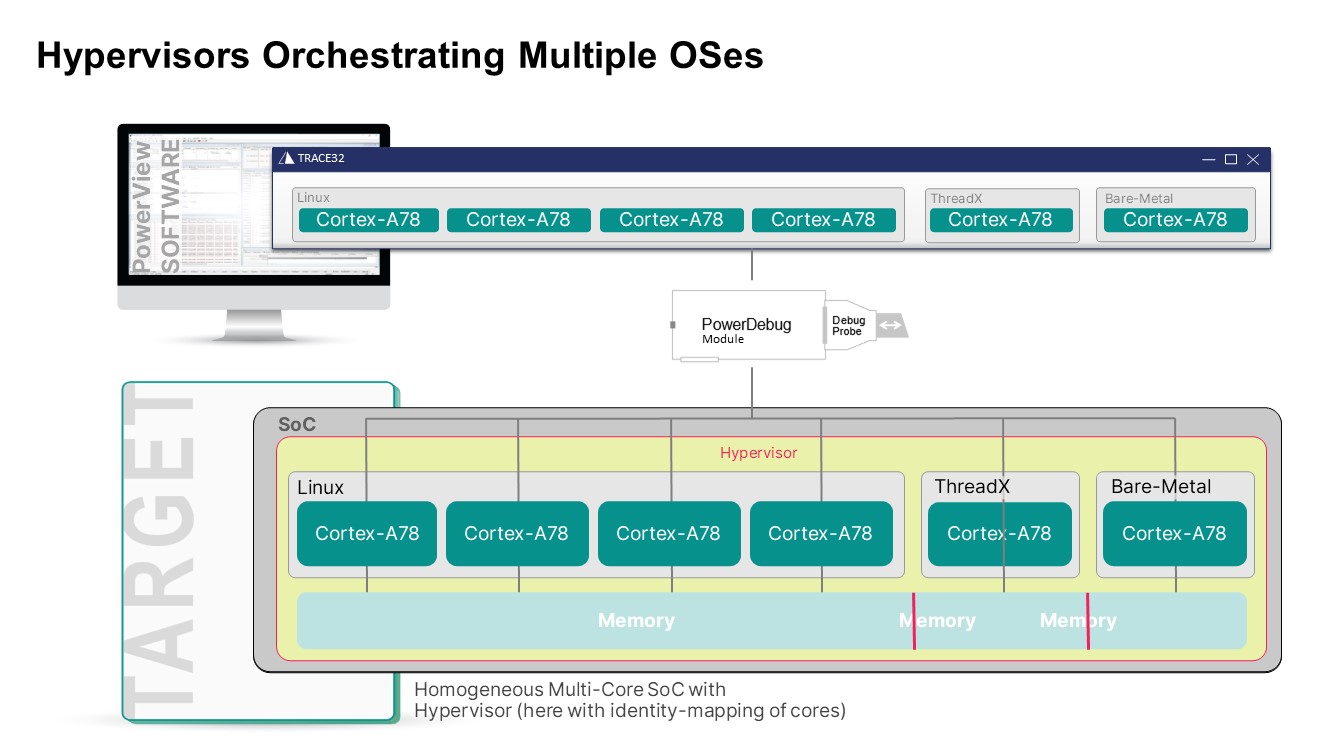
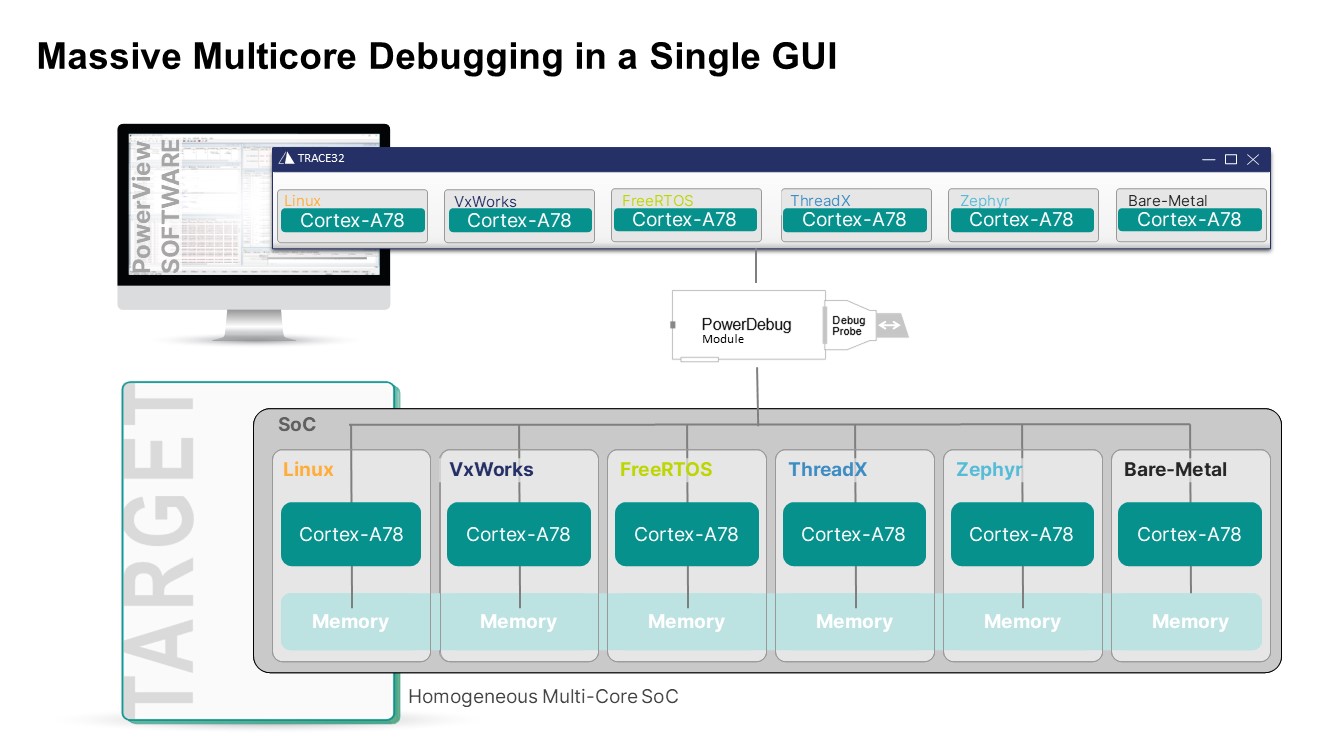
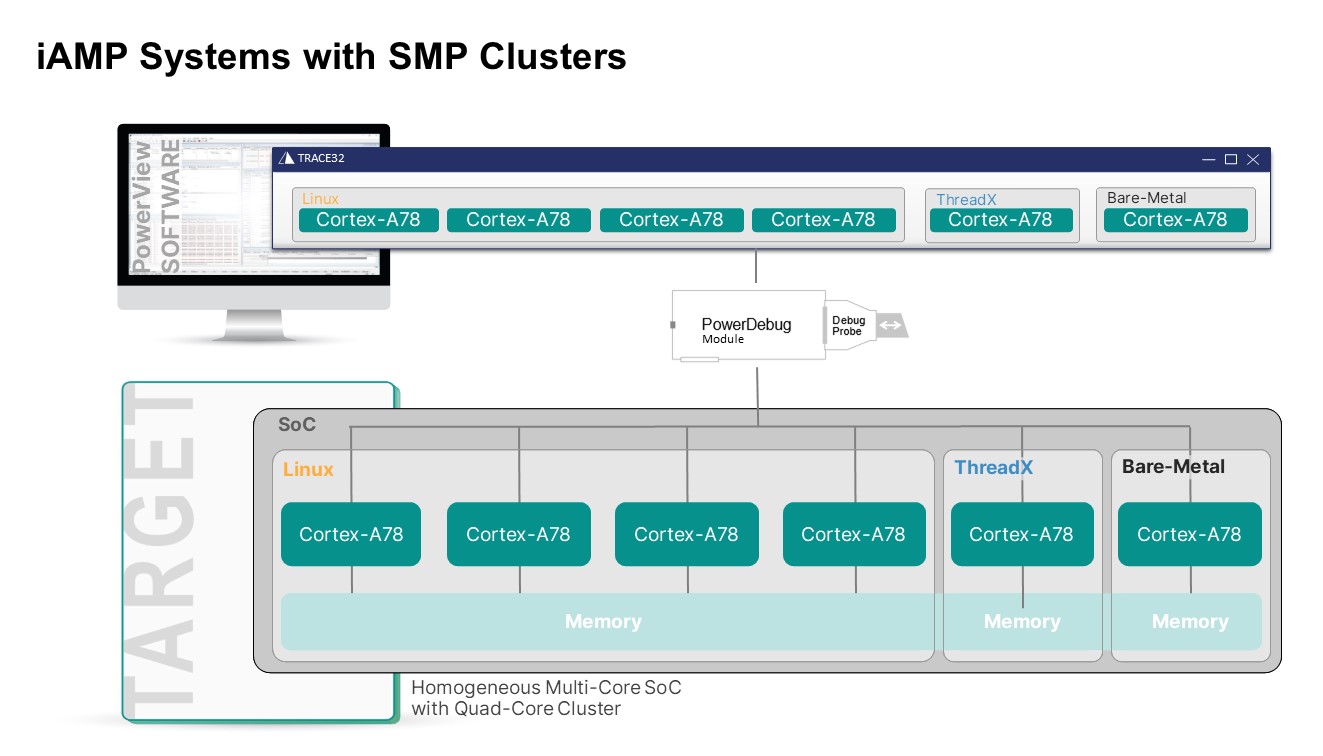
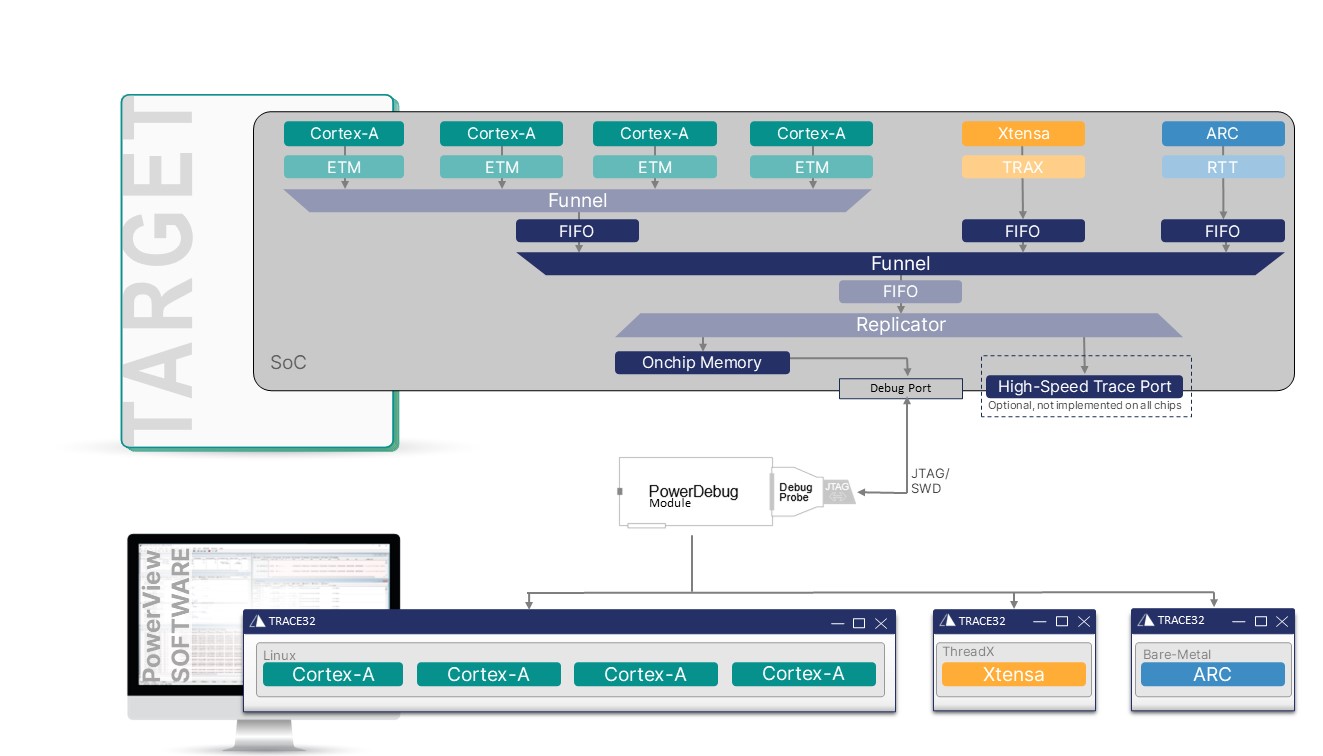
The application cores are typically configured as an SMP cluster running a rich OS like Linux, while the other cores usually operate asynchronously.

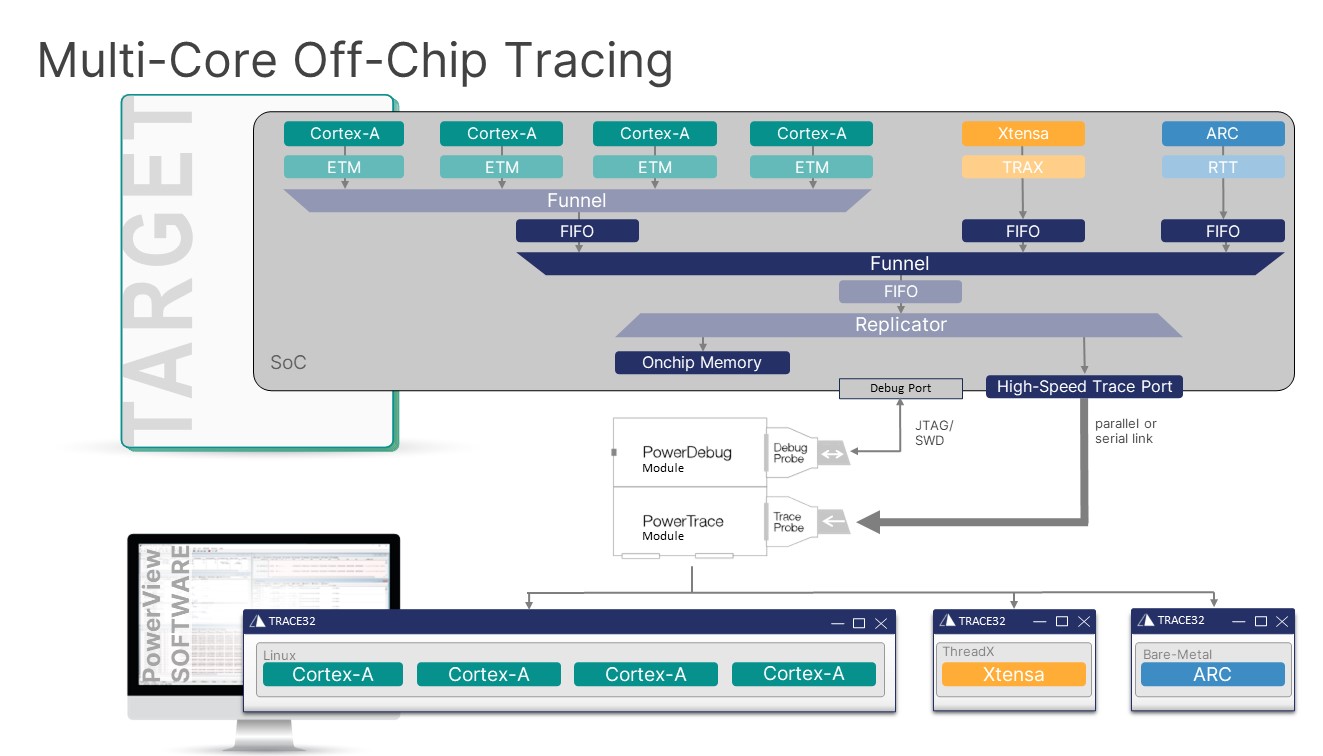
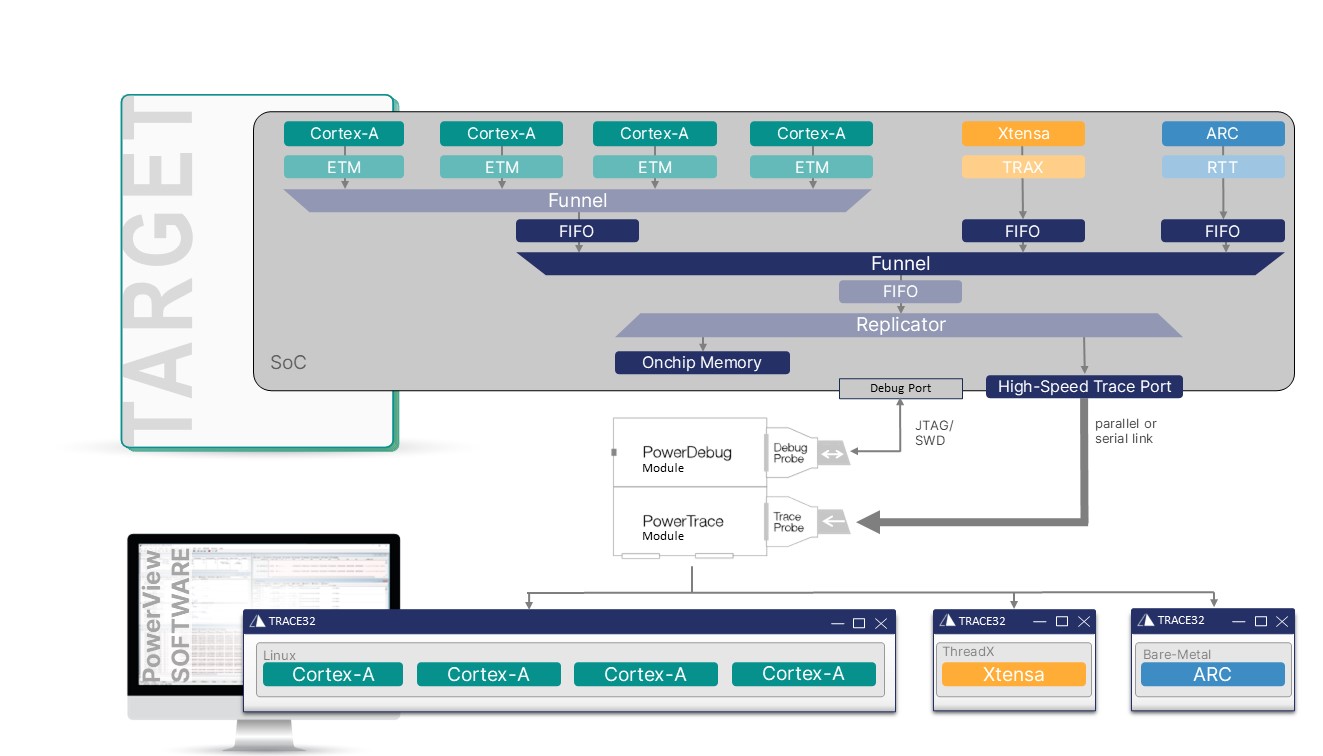
Our TRACE32® tools can debug all cores concurrently. You can trace the Cortex-A and Cortex-R cores via parallel or serial Off-Chip-Trace or via On-Chip-Buffers.

Explore Your Best Fitting TRACE32® Tools for ZYNQ

Debug and Trace Infineon AURIX™ TC4x

MCU for automotive applications focused on embedded safety, security and real-time control.

Implements:

  • Up to six TriCore™ V1.8. Cores.
  • Optional Generic Timer Module (GTM).
  • Parallel Processing Unit (PPU) based on ARC-EV.
  • Cyber Security Realtime Module (CSRM) based on TriCore.
  • Standby Controller (SCR) based on XC800.
  • Programmable digital signal processing (cDSP).

All cores operate usually asynchronously (AMP) with the main TriCore cores running an AUTOSAR operating system.

Our TRACE32® tools can debug all cores concurrently. AMP is available for all cores, where SMP and iAMP is also an option for TriCore. The major cores can be traced via serial Off-Chip-Trace or via On-Chip-Buffers.

Explore Your Best Fitting TRACE32® Tools for AURIX

Debug Intel® Xeon® Silver Processor

The Intel® Xeon® Silver processors offer improved memory speed, low latency, and energy efficiency for entry-level computing, networking and storage in the data center.

Implements:

  • Up to 12 x Intel® Sapphire Rapids x86 CPUs

Our tools can debug all cores concurrently. Real-time trace is supported via On-Chip-Buffers.

Explore your Best Fitting TRACE32® Tools for Intel® Xeon®

Debug NVIDIA DRIVE™ Orin™ SoC

Central computer for intelligent vehicles, powering autonomous driving capabilities, confidence views, digital clusters, and AI cockpits.

Implements:

  • 12 x Arm® Cortex®-A78AE
  • 4 x Arm® Cortex®-R52

Our tools can debug all cores concurrently. All cores can be debugged in AMP, SMP or iAMP configurations. Real-time trace is supported via high-speed serial-trace or via On-Chip-Buffers.

Explore Your Best Fitting TRACE32® Tools for Orin

NXP i.MX8 QuadMax

Industrial, Automotive and Infotainment Applications Processor

Implements:

  • 1 x High-performance Application Core Arm® Cortex®-A72
  • 4 x High- efficiency Application Cores Arm® Cortex®-A53
  • 2 x Real-Time Cores Arm® Cortex®-M4F
  • 1 x System Control Unit Arm® Cortex®-M4F
  • 1 x Audio Processor Cadence® Tensilica® HiFi 4 DSP Xtensa-LX7
  • 1 x Security Controller (SECO) Arm® Cortex®-M0+
  • 1 x Platform Management Unit MicroBlaze Hard-IP

The application cores usually run a rich OS like AUTOSAR Adaptive, Linux, Android Automotive or QNX, where the Cortex-A53 cores operate as a SMP cluster. The real-time cores usually run an AUTOSAR Classic or any other real-time operating system.

Our tools can debug all cores concurrently via a single debug interface (SWJ-DP). All application and real-time cores can be traced via On-Chip-Buffers or the PCIe interface of the chip.

Explore Your Best Fitting TRACE32® Tools for i.MX8 QuadMax

Debug Qualcomm Snapdragon™ SoCs

Processor family for mobile devices and vehicles.

Implements:

  • Kryo or Krait Armv7/v8 application cores.
  • Qualcomm® Hexagon™ DSPs
  • Further sub-controllers, GPUs and DSPs.

Snapdragon processors usually contain a large number of CPU cores.

We support not only the application cores, but also most of the various other cores on the SoCs. As usual our goal is to debug all cores concurrently via a single physical interface.

The exact topology of each Snapdragon is confidential. Please contact Qualcomm for more details.

Explore Your Best Fitting TRACE32® Tools for Snapdragon

Debug and Trace Texas Instruments AM69Ax

Processor for Autonomous Mobile Robots and Machine Vision

Implements:

  • 8 x Application Cores Arm® Cortex®-A72 organized in two clusters.
  • 2 x General Compute Real-Time Cores Arm® Cortex®-R5F.
  • 2 x Device Management Cores Arm® Cortex®-R5F.
  • 4 x Deep Learning Accelerator TI C7x DSPs.
  • 2 x Security Management Cores (SMS) Arm® Cortex®-M4.

The two application clusters typically run synchronously with a rich OS like Linux, while the other cores operate usually asynchronously.

Our TRACE32® tools can debug and trace all cores concurrently via the chip’s parallel trace port (TPIU) with a maximum port size of 32 bits.

Explore Your Best Fitting TRACE32® Tools for AM69Ax