CombiProbe Compact Trace


Compact Debug and Trace Probe for Mid-Range Embedded Systems
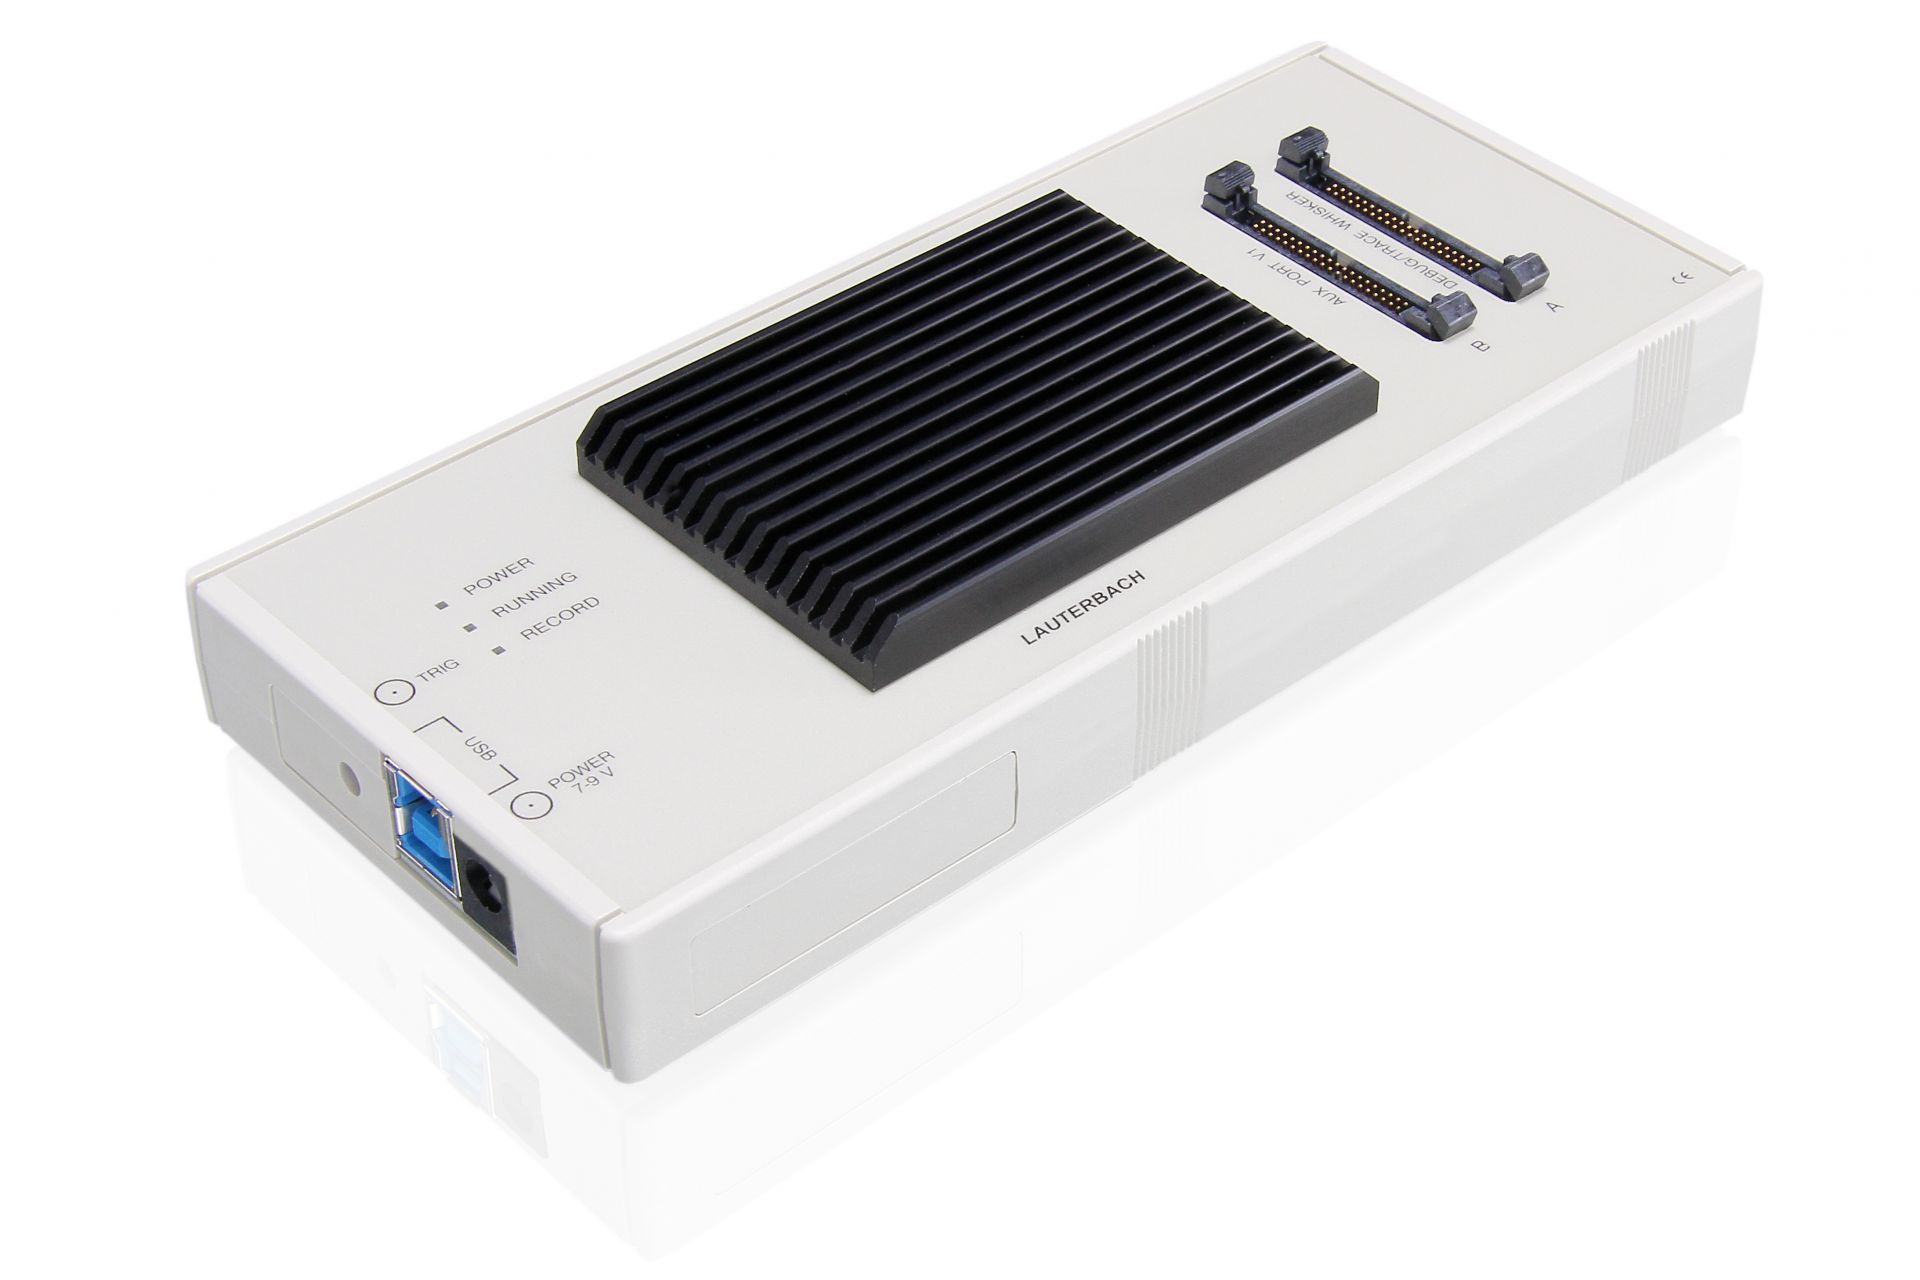
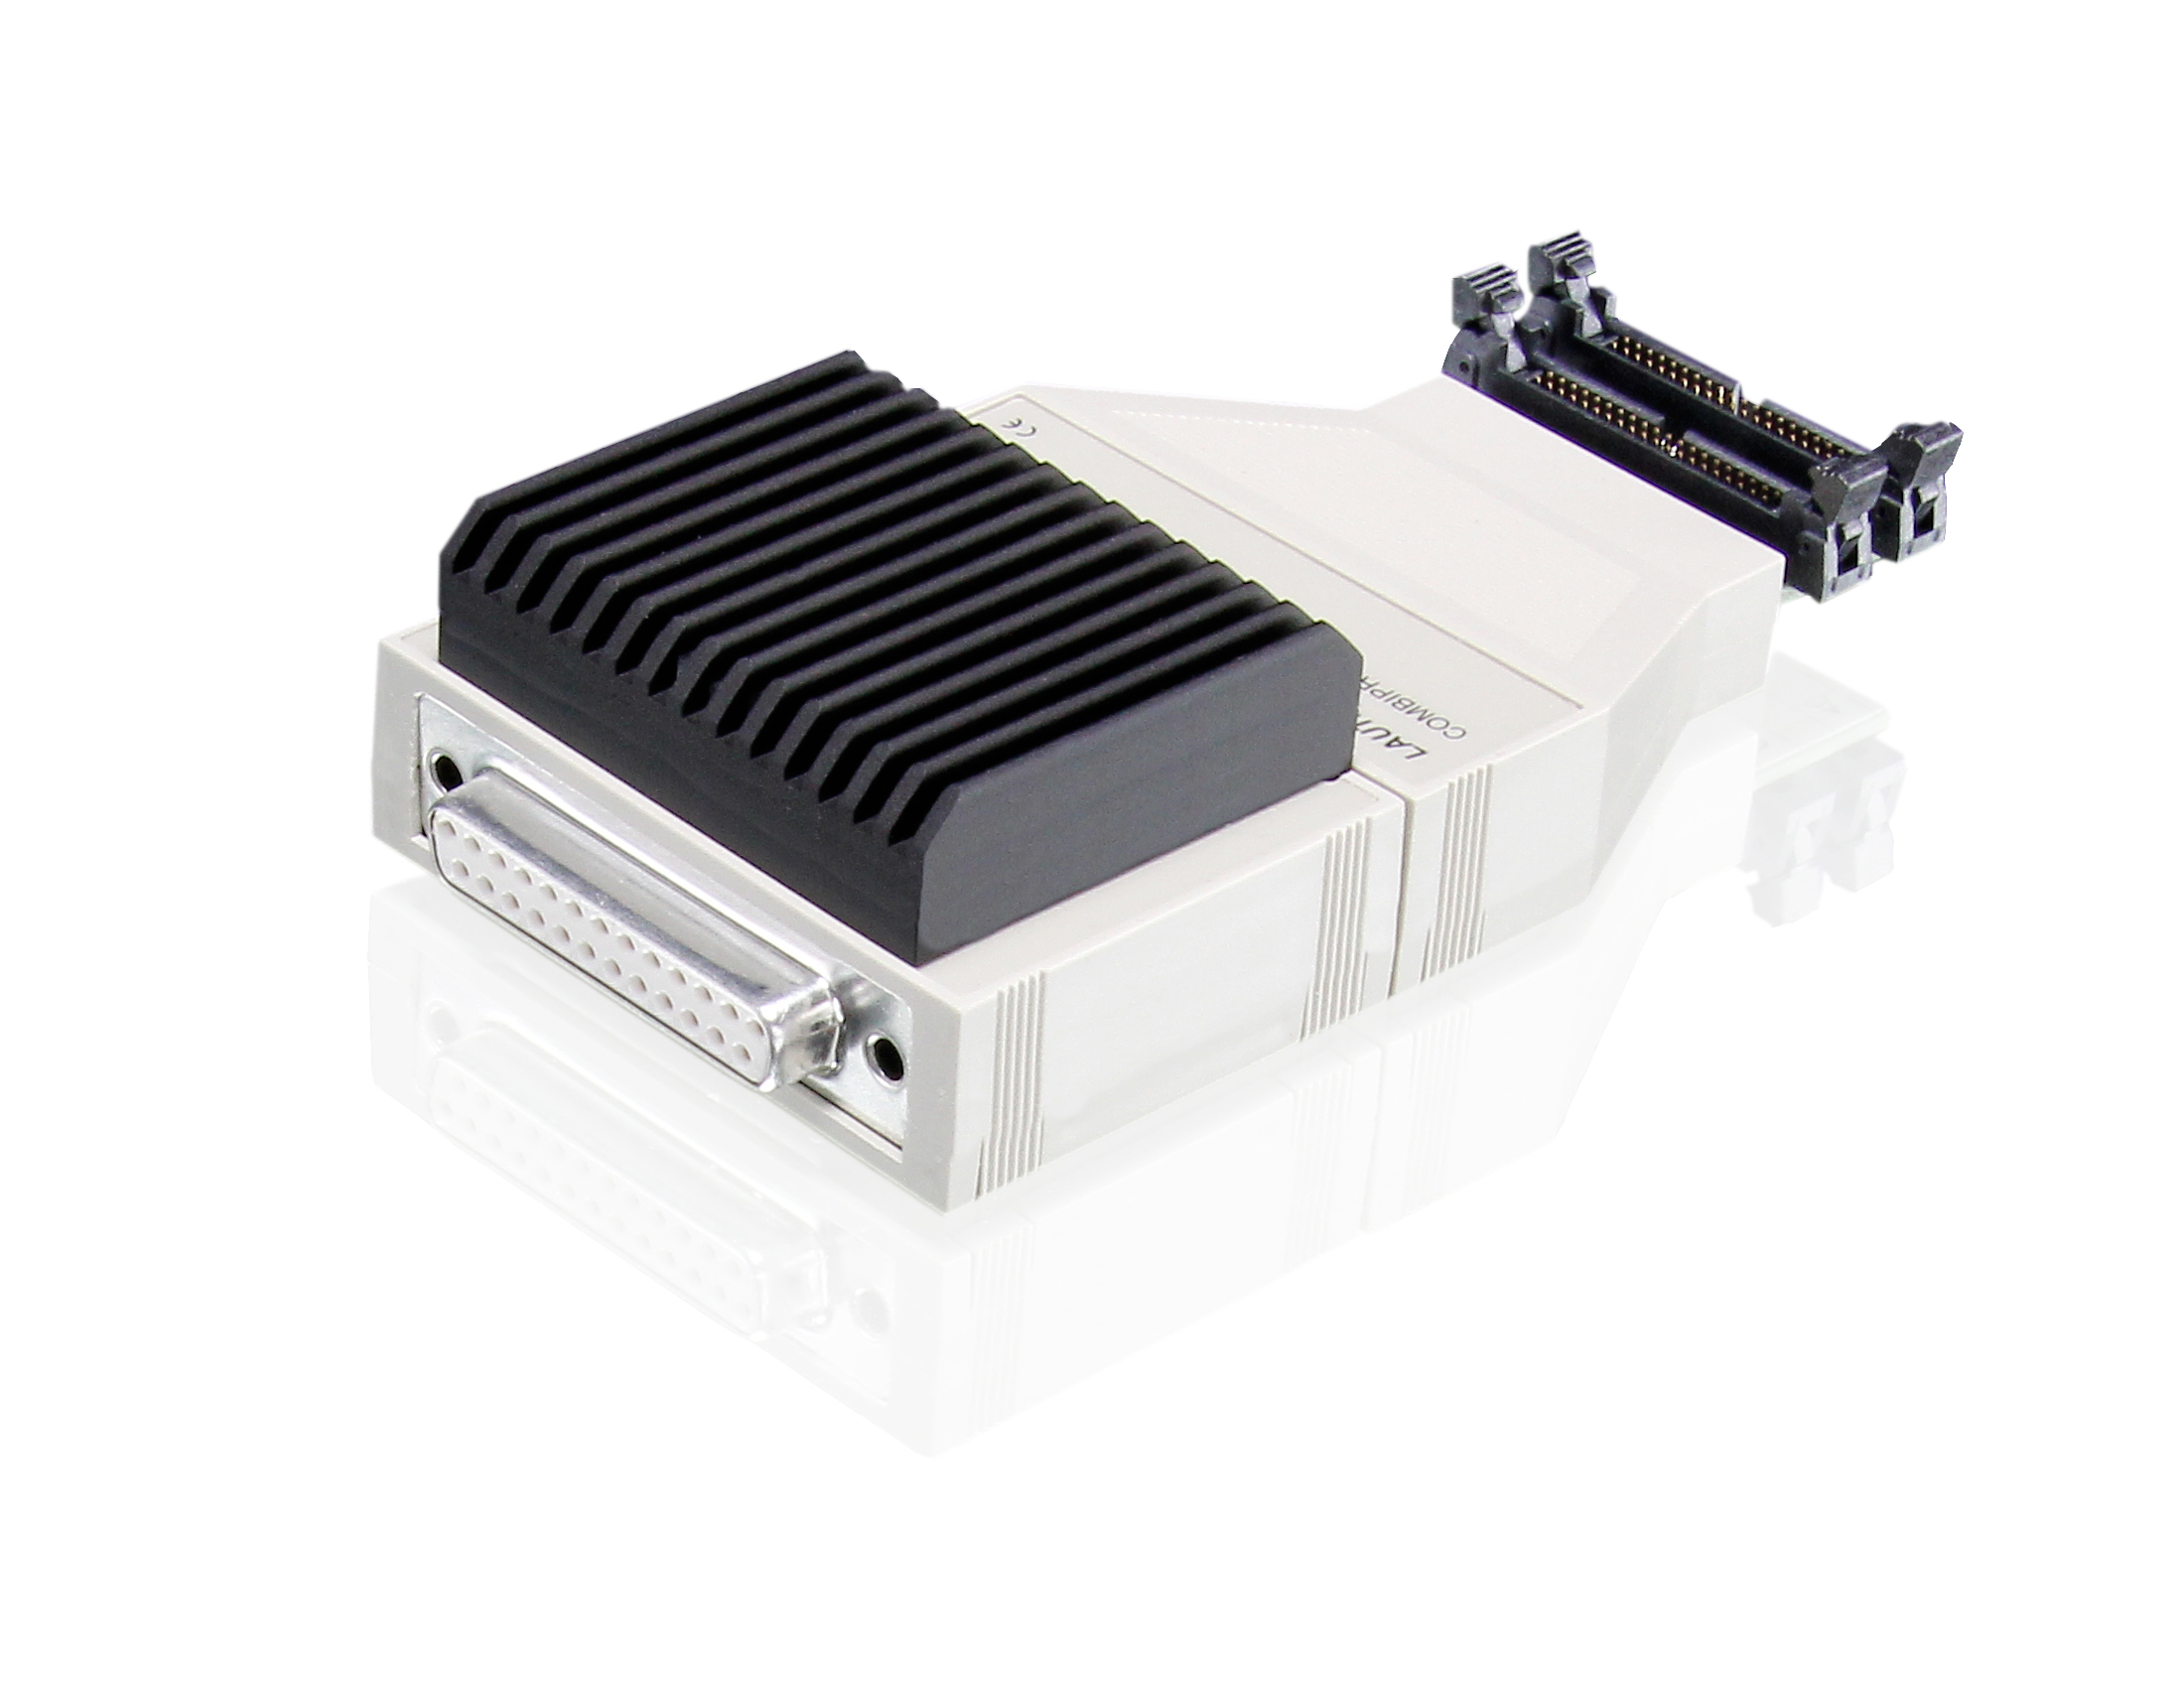
Leverage the power of a full trace system geared towards your mid-range embedded design. The CombiProbe 2 is a compact debug and trace probe that provides our full feature set to embedded systems with compact trace ports of up to 4 bits wide.
Compare Trace Extensions
This product |
|||||
 |
 |
 |
 |
 | |
| Product | µTrace for Cortex-M | CombiProbe 2 |
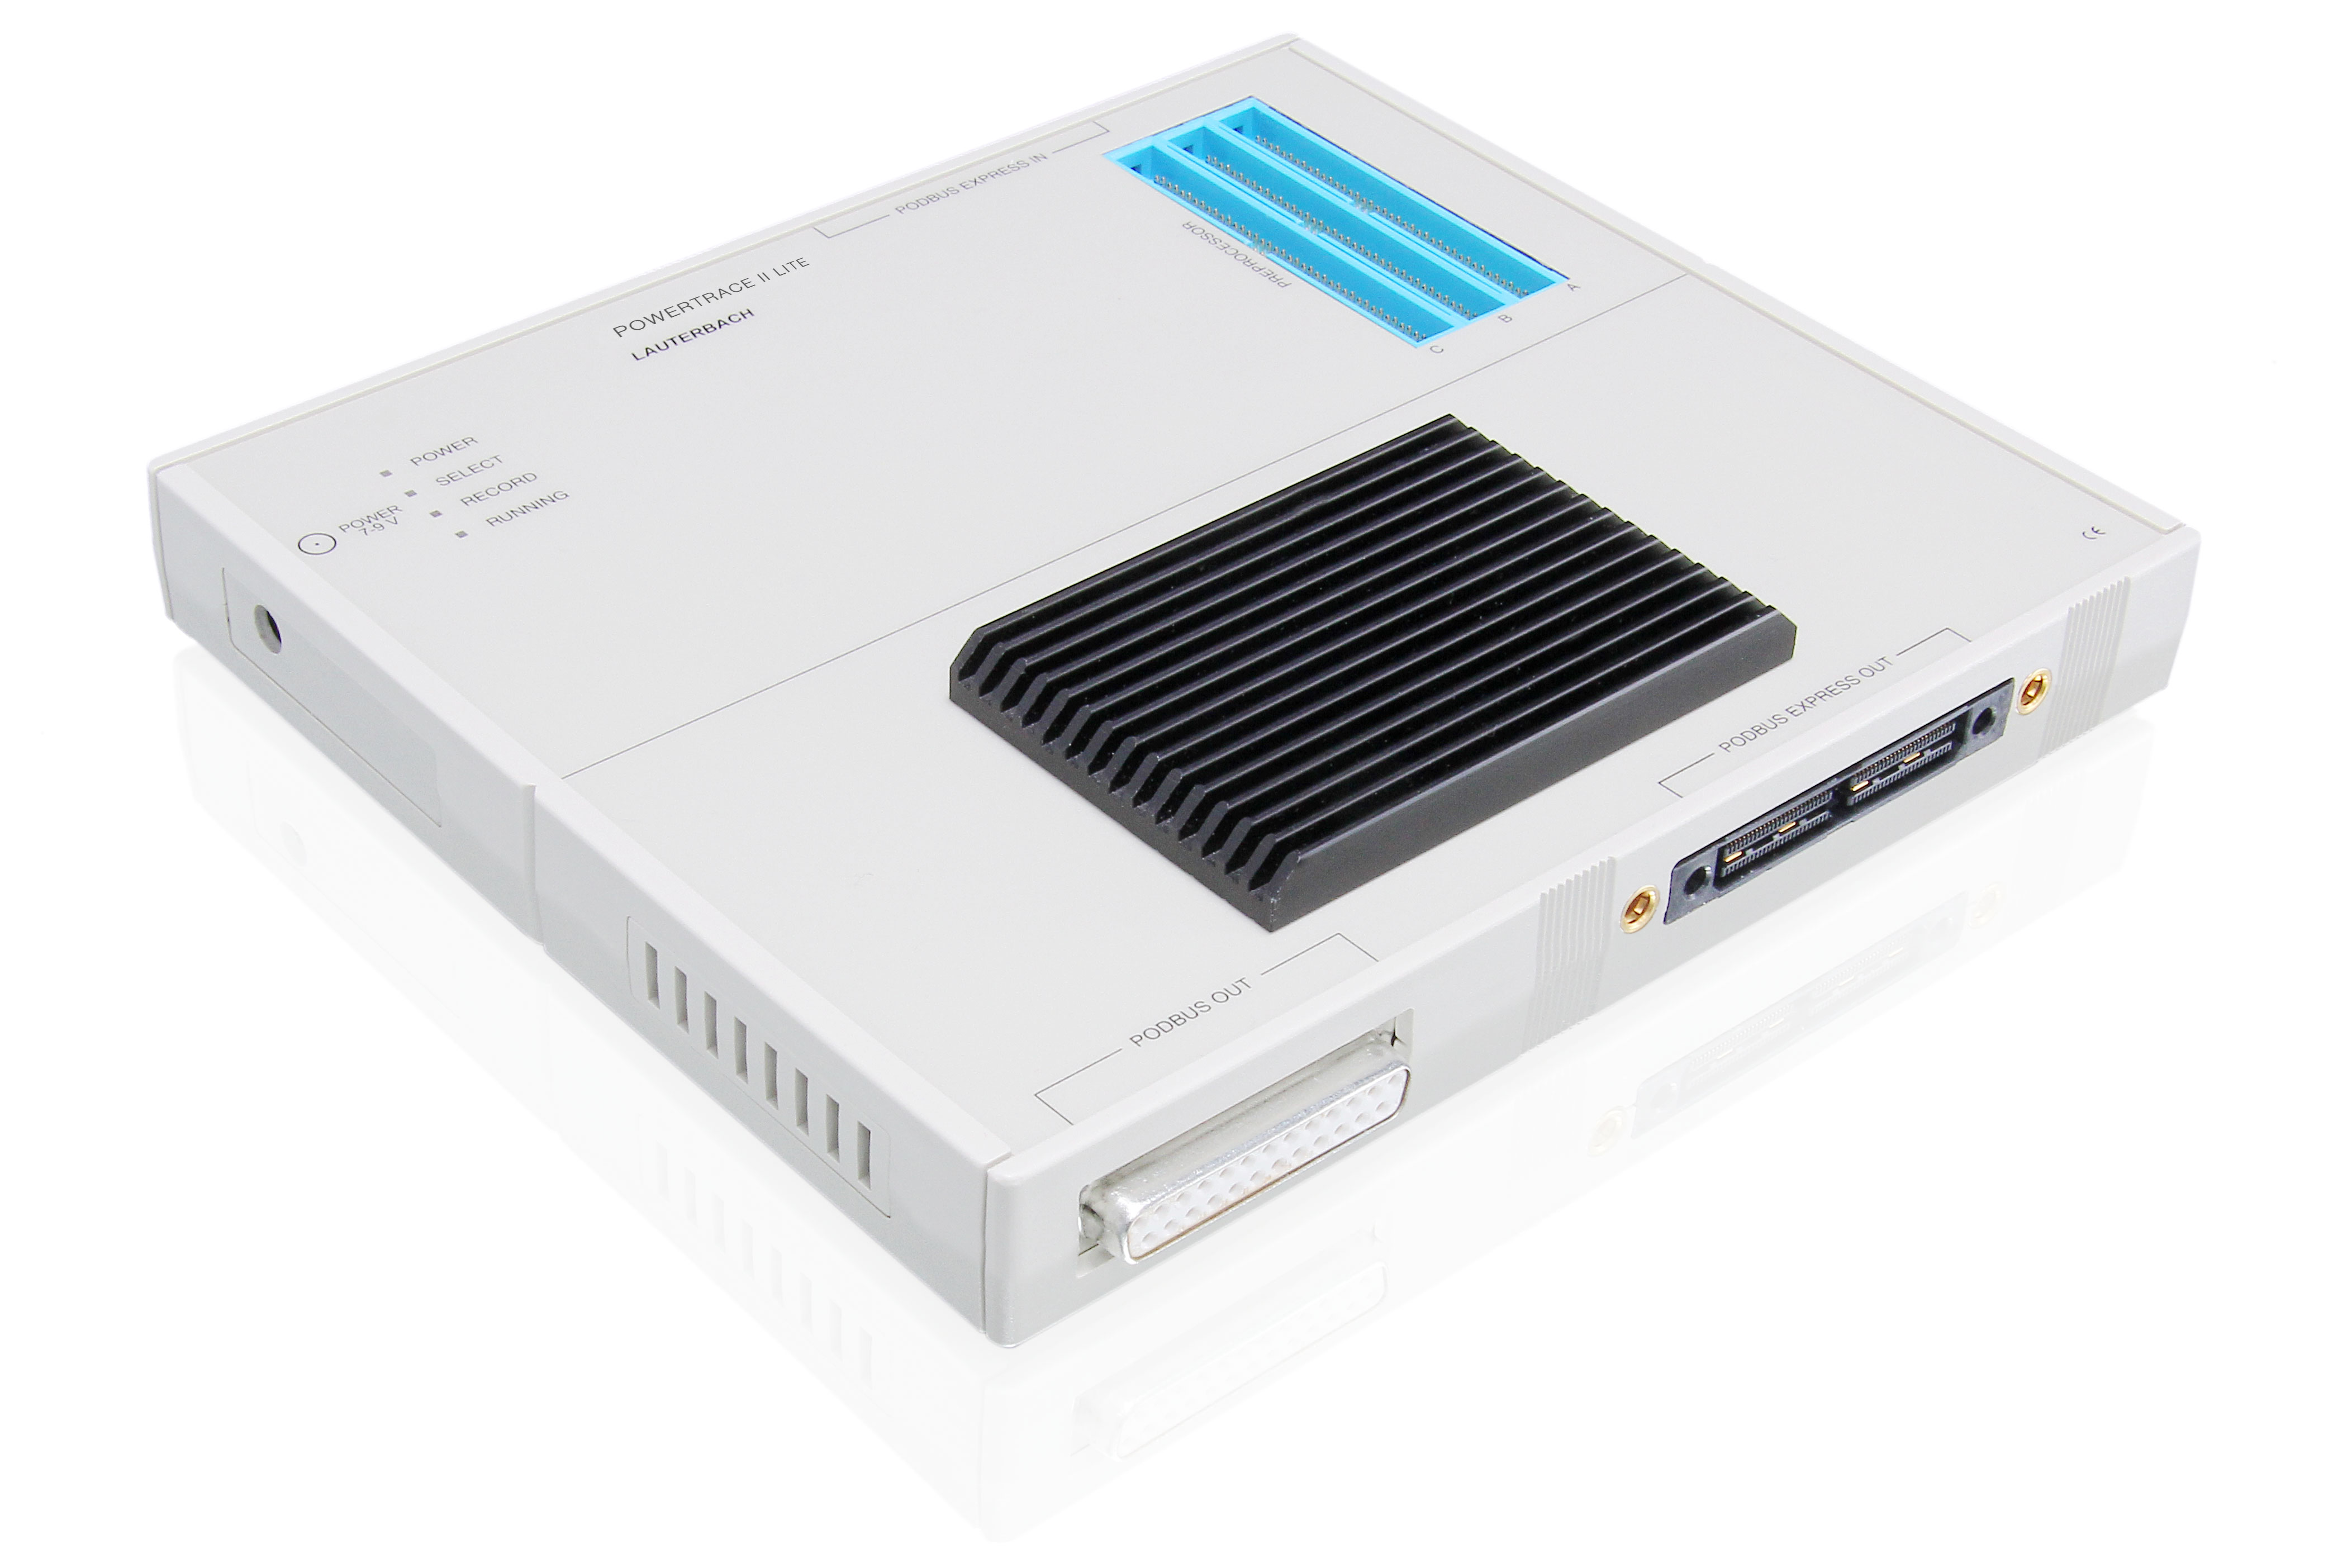
PowerTrace II Lite |
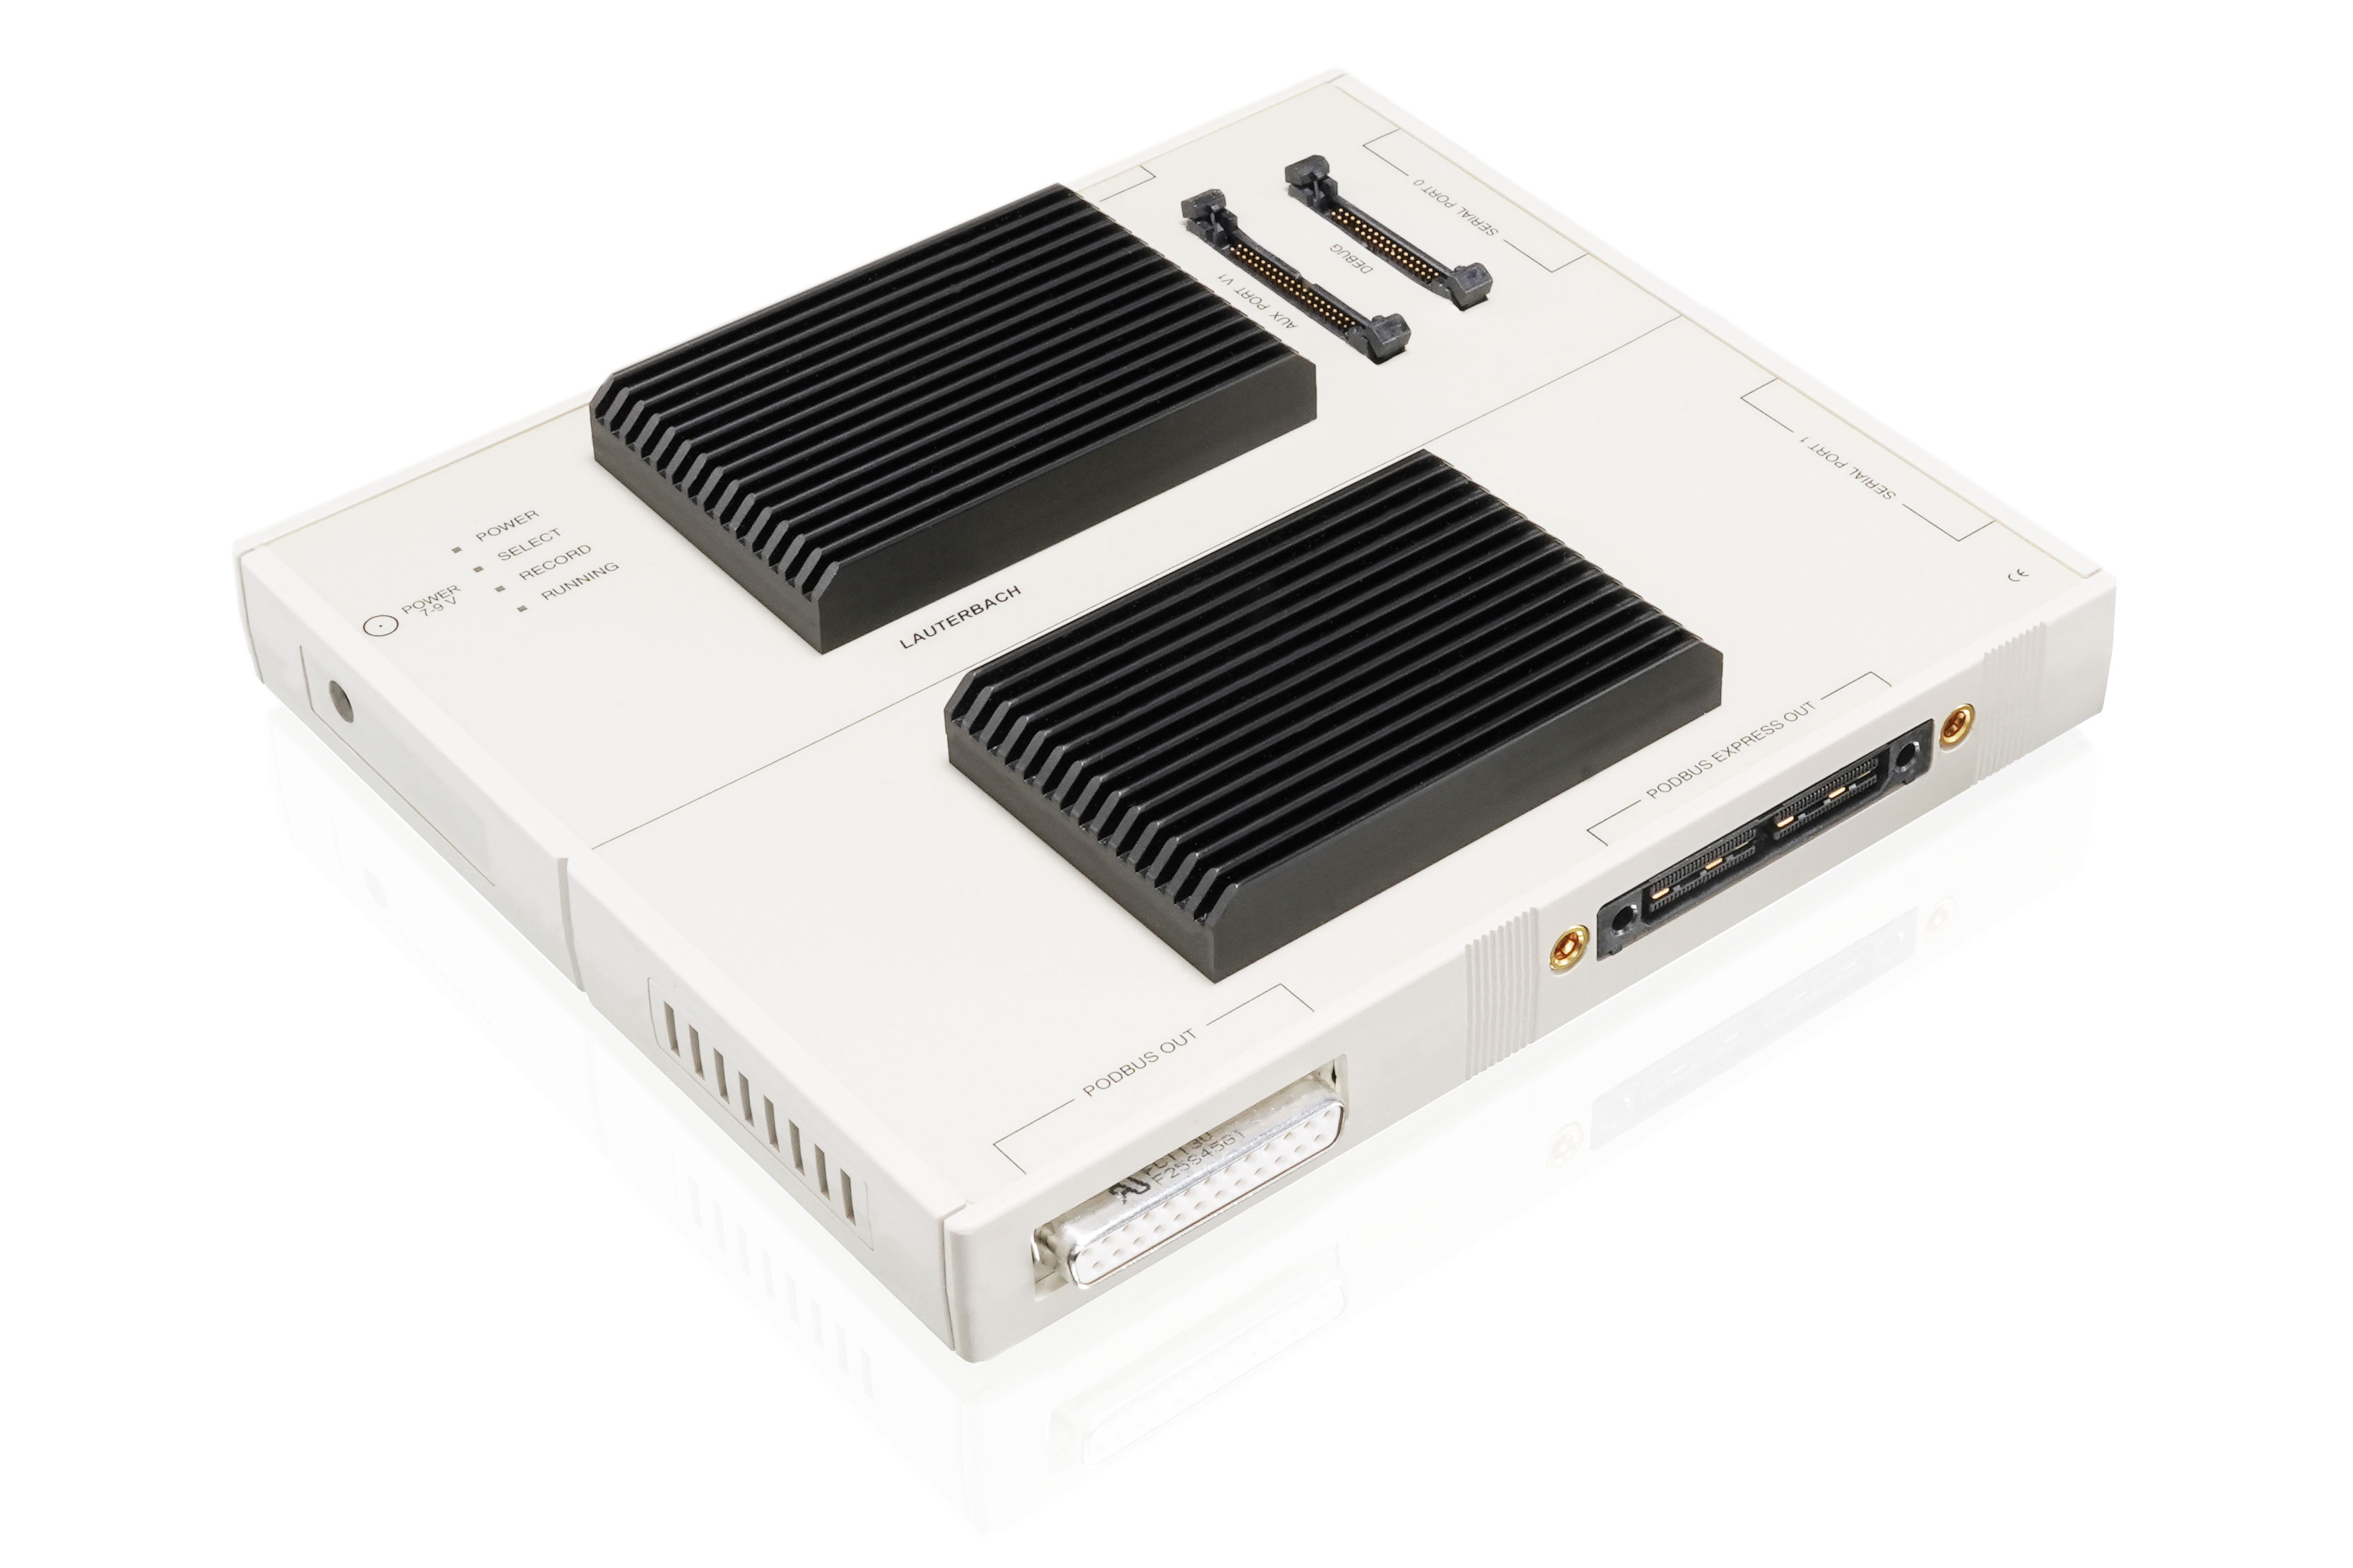
PowerTrace III | PowerTrace Serial 2 |
| Memory Size | 256 MByte | 512 MByte | 1 GByte | Up to 8 GByte | Up to 8 GByte |
| Max. Trace Port Width | 4 parallel lines | Two ports with 4 parallel lines | 32 parallel lines | 32 parallel lines | 8 serial lanes |
| Max.Recording Speed | 400 Mbit/s per line | 400 Mbit/s per line | 450 Mbit/s per line @ 17 lines | 600+ Mbit/s per line @ 17 lines | 22.5 Gbit/s per lane @ 4 lanes |
| Max. Streaming Performance 1 (Peak / Average) |
up to 200 / 140 MByte/s | 200 / 140 MByte/s | 1 350 / 100 MByte/s | 2 400 / 400 MByte/s | 10 000 / 400 MByte/s |
| Option for Energy profiling | Via Mixed-Signal Probe | Via Mixed-Signal Probe | Not Available | Via Mixed-Signal Probe | Via Mixed-Signal Probe |
| Required debug module | - | PowerDebug2 | PowerDebug X513 | PowerDebug X513 | PowerDebug X513 |
| See more |
See more |
See more | See more |
1 The streaming rate defines the amount of data which can be transferred on the fly to the PC per second. If the trace-port rate is below the streaming rate in average, a practically infinite recording time is possible. The peak-rate is possible temporarily and is compensated by the internal memory of the CombiProbe.
2CombiProbe 2 works with PowerDebug X50, X51, E50, E40, PRO, USB 3, II. Not supported are PowerDebug Ethernet, USB, USB 2.
3 PowerTrace extensions work with PowerDebug X50, X51, PRO, II.
Connect Your Target Optimally with Your CombiProbe 2
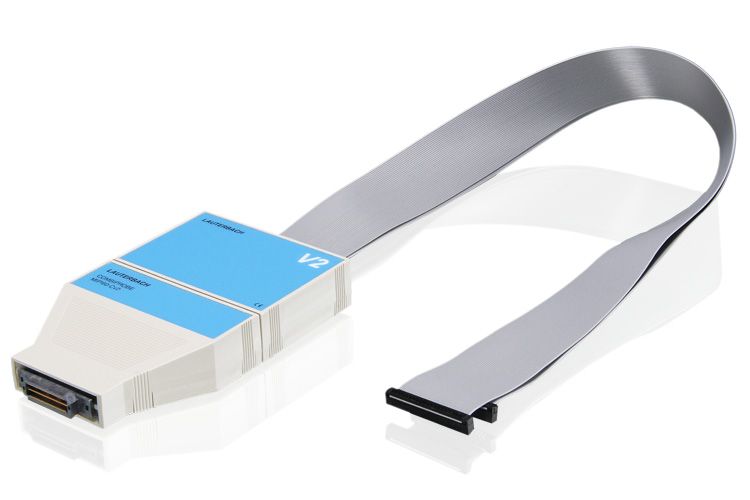
A whisker is the physical link from your target's debug and trace port to your CombiProbe 2. With the whisker’s transceivers located close to the target, it provides the firmest signal stability at the highest transfer speeds. Each of our whisker models is optimized to perfectly match the physical and electrical specification of the target's debug and trace ports.
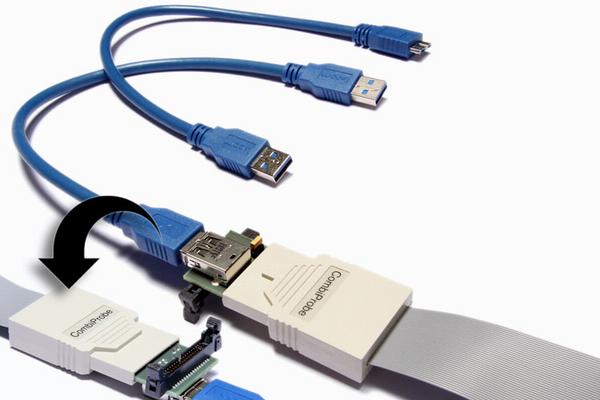
Two multipurpose connectors enable your CombiProbe 2 to operate two Whiskers at once. Your CombiProbe 2 can debug and trace two completely separate target SoCs at the same time while allowing you to observe the precise timing of events within and between both SoCs.
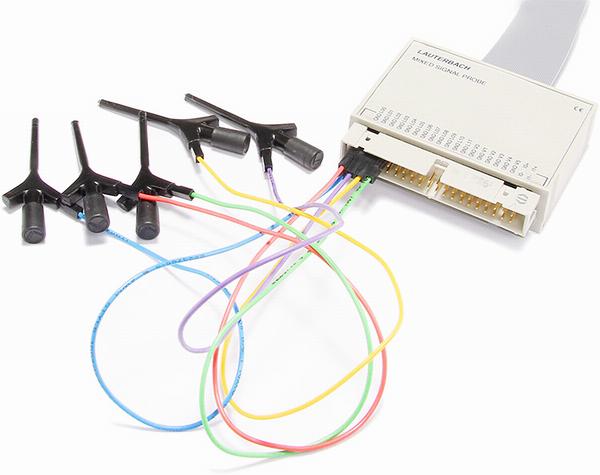
Moreover, one multipurpose connector can be equipped with our optional Mixed-Signal Probe, enriching the trace analysis with time-correlated external analog and digital signals, enabling energy profiling, communication bus decoding, voltage fluctuation detection, and more.


Maximize Bandwidth with AutoFocus Technology
To connect your target’s debug/trace port to the CombiProbe, you need a whisker, which exists in several variants for different needs.
The most popular variants are the MIPI20T-HS and MIPI34 whisker. Both support our AutoFocus technology, which automatically adjusts the sampling point for each signal of your trace lines. This results in more reliable trace capture, with less concern about board routing, impedance, and length matching.
Know the AutoFocus technology


Configuration Examples for CombiProbe 2
Debug and Trace of Dual-Chip Arm Cortex-M Processors
Safety critical applications often use two redundant processors making identical calculations. If the two separate embedded systems do not reach a consensus, the applications have to fall back to a safe state. A CombiProbe 2 with two Whiskers lets you develop this system by allowing you to record the dynamic behavior of both control units, timestamp the events with the same clock, and thus allow you to precisely follow the interaction between both units.
- PowerDebug E40
- CombiProbe 2
- 2 x MIPI20T-HS Whisker
Analyze Automotive SoCs with AUTOSAR Adaptive Platform
Profile your AUTOSAR Adaptive Platform using the System Trace Microcell (STM). Arm SoCs can emit high-level messages created by the target’s software stack. Lauterbach provides an ARTI kernel driver which provides you with information about your AUTOSAR Adaptive Applications and their states by using the STM messages captured by the CombiProbe 2.
Using a Mixed-Signal Probe, you may capture any related external events e.g. CAN frames.
- PowerDebug E40
- CombiProbe 2
- MIPI20T-HS Whisker
- Mixed-Signal Probe

Debug Intel® CPUs
The MIPI60-Cv2 Whisker for our CombiProbe 2 was specially designed to support the Intel® Debug Port Specification. Thus, this configuration includes hook pins for special functions (e.g. stall execution during reset sequence), can receive PMODE packages, and has extra survivability features to manually control threshold voltages and slew rates. Furthermore, two independent JTAG chains and system trace are supported.
- PowerDebug E40
- CombiProbe 2
- MIPI60-Cv2 Whisker
Benefit from RISC-V Compact Trace
While you can debug any RISC-V core with a CombiProbe 2, its real power is unleashed with SoCs containing RISC-V cores from SiFive. These cores often implement a Nexus trace with a 4-bit Pin Interface Block (PIB) off-chip trace interface, which allows you to record the program flow over time for profiling your code performance or to find tricky bugs which only appear in real time. Your CombiProbe 2 will support the upcoming N-Trace Specification once it is ratified by the RISC-V Foundation.
The Mixed-Signal Probe can record your system's power consumption and correlate it with the program flow to pinpoint power-hungry code sections.
- PowerDebug E40
- CombiProbe 2
- MIPI20T-HS Whisker
- Mixed-Signal Probe
Sets featuring the CombiProbe
")
CombiProbe 2 with MIPI20-HS whisker for debugging and tracing. Supports debugging via JTAG, cJTAG, SWD, I3C and more. Voltage Range: 1.2V...5.0V. Target Connector: MIPI20T, MIPI10. Trace Memory: 512 MByte. Maximum Trace Port Width: 4 pins. Maximum Trace Bandwidth: 400 MBit/s per trace pin. Includes the TRACE32 software for Windows, Linux and macOS on DVD and for download. Requires at least one of the following A-licenses: LA-3743A Debug. for Cortex-A/R (Armv8 and Armv9) Add. LA-7844A Debug Cortex-M (Armv6/7/8 32-bit) Add. LA-7843A Debug Cortex-A/-R (Armv7 32-bit) Add. LA-7765A JTAG Debugger License for Arm11 Add. LA-7742A JTAG Debugger License for Arm9 Add. LA-7746A JTAG Debugger License for Arm7 Add. LA-2540A Debugger for RISC-V 32-bit Add. LA-2541A Debugger for RISC-V 64-bit Add. Requires trace license LA-7970X for on-chip ETM traces of Cortex-A/R. Requires trace license LA-2767X for RISC-V off-chip traces emitted via a 4-bit Pin Interface Block (PIB). Requires Power Debug Interface USB 3.0, PowerDebug II, PowerDebug PRO, PowerDebug X-Series, PowerDebug E-Series. Extend your CombiProbe with a Mixed-Signal Probe (LA-2500), to record and correlate digital and analog signals.
")
CombiProbe 2 with AUTO26 Whisker for debugging and DAP Streaming, supporting DAP (DAP2, DAP3, DAP4, DAPWide), JTAG, DXCPL/DXCM. For optimal performance, we recommend using a DAP mode. DAP streaming is supported for TriCore (in DAP mode) and works most effectively with DAPWide (up to 320 Mbit/s). For DXCPL/DXCM, you will likely require the CAN-Box (LA-3889) as well. Voltage Range: 1.8V to 5.0V. Debug Clock Frequency: 10 kHz to 160 MHz Target Connector: AUTO26, AUTO20, AUTO10 Trace Memory: 512 MByte. Includes the TRACE32 software for Windows, Linux and macOS on DVD and for download. Requires the following A-license: LA-7756A (Debugger for TriCore Standard Additional). Trace analysis and display requires LA-3799X (Trace License for TriCore ED). Requires Power Debug Interface USB 3.0, PowerDebug II, PowerDebug PRO, PowerDebug X-Series, PowerDebug E-Series. Please note that TriCore SoCs usually support only 3.3V or 5V in DAP mode. Debug clock frequency in JTAG mode is typically limited to 40 MHz on TriCore SoCs (while up to 160 MHz is supported in DAP mode). Extend your CombiProbe with a Mixed-Signal Probe (LA-2500), to record digital and analog signals and correlate them with MCDS DAP streaming. (Requires PowerView R.2024.02 or higher). Alternatively extend your CombiProbe with a second AUTO26 Whisker (LA-4553) and a multicore license (LA-7960X) to debug and trace two TriCore chips simultaneously. (Req. PowerView R.2024.09 or higher).
")
CombiProbe 2 with MIPI34 whisker for debugging and tracing. Voltage Range: 1.2V...3.3V (5V tolerant inputs). Target Connector: MIPI34, MIPI20T, MIPI10 Trace memory: 512 MByte. Maximum trace port width: 4 pins. Maximum trace bandwidth: 200 MBit/s per trace pin. Includes the TRACE32 software for Windows, Linux and macOS on DVD and for download. Requires at least one of the following A-licenses: LA-3743A Debug. for Cortex-A/R (Armv8 and Armv9) Add. LA-7844A Debug Cortex-M (Armv6/7/8 32-bit) Add. LA-7843A Debug Cortex-A/-R (Armv7 32-bit) Add. LA-7765A JTAG Debugger License for Arm11 Add. LA-7742A JTAG Debugger License for Arm9 Add. LA-7746A JTAG Debugger License for Arm7 Add. Requires trace license LA-7970X for on-chip ETM traces of Cortex-A/R. Requires Power Debug Interface USB 3.0, PowerDebug II, PowerDebug PRO, PowerDebug X-Series, PowerDebug E-Series. Extend your CombiProbe with a Mixed-Signal Probe (LA-2500), to record and correlate digital and analog signals.
")
CombiProbe 2 to debug and trace MIPS32 CPUs with 4 Bit IFLOW trace. Voltage Range: 1.2V...3.3V (5V tolerant inputs). Target Connector: MIPI34, MIPI20T, MIPI10, eJTAG/IFLOW. Trace memory: 512 MByte. Maximum trace port width: 4 pins. Maximum trace bandwidth: 200 MBit/s per trace pin. Iincluded adapter for eJTAG and IFLOW connector. Includes the TRACE32 software for Windows, Linux and macOS on DVD and for download. Requires the following A-license: LA-7760A (JTAG Debugger for MIPS32). 4-Bit IFlow program trace requires: LA-7971X (Trace License for the MIPS32). Requires TRACE32 Software R.2022.02 (build 142224) or newer. Requires Power Debug Interface USB 3.0, PowerDebug II, PowerDebug PRO, PowerDebug X-Series, PowerDebug E-Series. Extend your CombiProbe with a Mixed-Signal Probe (LA-2500), to record and correlate digital and analog signals.
(PACK)")
CombiProbe 2 with MIPI60-Cv2 Whisker for debugging of Intel® SoCs. Supports 8 HOOK pins and 2 JTAG ports. Voltage range 1.0V to 1.8V. Includes 5 Inch flexible flat cable for target connection. Includes the TRACE32 software for Windows, Linux and macOS on DVD and for download. Requires suitable A-license for debugging. Requires Power Debug Interface USB 3.0, PowerDebug II, PowerDebug PRO, PowerDebug X-Series, PowerDebug E-Series.
 (PACK)")
CombiProbe 2 with MIPI60-Cv2 Whisker for debugging of Intel® SoCs. Supports 8 HOOK pins and 2 JTAG ports. Voltage range 1.0V to 1.8V. Includes 12 Inch flexible flat cable for target connection. Includes the TRACE32 software for Windows, Linux and macOS on DVD and for download. Requires suitable A-license for debugging. Requires Power Debug Interface USB 3.0, PowerDebug II, PowerDebug PRO, PowerDebug X-Series, PowerDebug E-Series.
")
CombiProbe 2 with DCI OOB v2 Whisker for closed chassis debugging via the Intel® Out Of Band (OOB) Direct Connect Interface (DCI). Includes the TRACE32 software for Windows, Linux and macOS on DVD and for download. Requires suitable A-license for debugging. Requires Power Debug Interface USB 3.0, PowerDebug II, PowerDebug PRO, PowerDebug X-Series, PowerDebug E-Series.
")
CombiProbe with two whisker cables to debug dual-core dsPIC controller from Microchip. Supports dsPIC33A, dsPIC33C, and dsPIC33E. Requires the following A-license: LA-2760A (Debugger for PIC Additional) LA-7960X (License for Multicore Debugging). Requires one of the following debug base modules: PowerDebug X-Series, PowerDebug E-Series PowerDebug PRO, PowerDebug II, PowerDebug USB 3. Includes two Debug Whisker with 26 pin connector (1.8V to 5.0V). Includes Converter to MICROCHIP-8 header. Includes TRACE32 software for Windows, Linux and macOS on DVD or via download.

Digital/Analog probe with 40-pin connector for LA-3204 MicroTrace for Cortex-M (PACK), LA-3080 CombiProbe 2 for MIPI20T-HS (PACK), LA-3081 CombiProbe 2 for AUTO26 (PACK), LA-3082 CombiProbe 2 for MIPS32+4-Bit IFLOW (PACK), LA-3083 CombiProbe 2 for MIPI34 (PACK), LA-2520 / LA-2521 PowerTrace III, LA-3121 / LA-3122 PowerTrace Serial 2. Characteristics of digital probe: 12 channels (12 data), 0..5 V Input, 200 MSamples per channel. Characteristics of analog probe: 6 Channels -12V..+12V 13 bit resolution, 2 current sense channels, Conversion rate 1 MSample/s. Includes a set of 12 miniature clamp-type test probes with wires. More test probes can be ordered via LA-6470 Clip Set. Requires TRACE32 software DVD 2021/02 or newer.