Debugger
OVERVIEW
The Core of Your Embedded Workspace
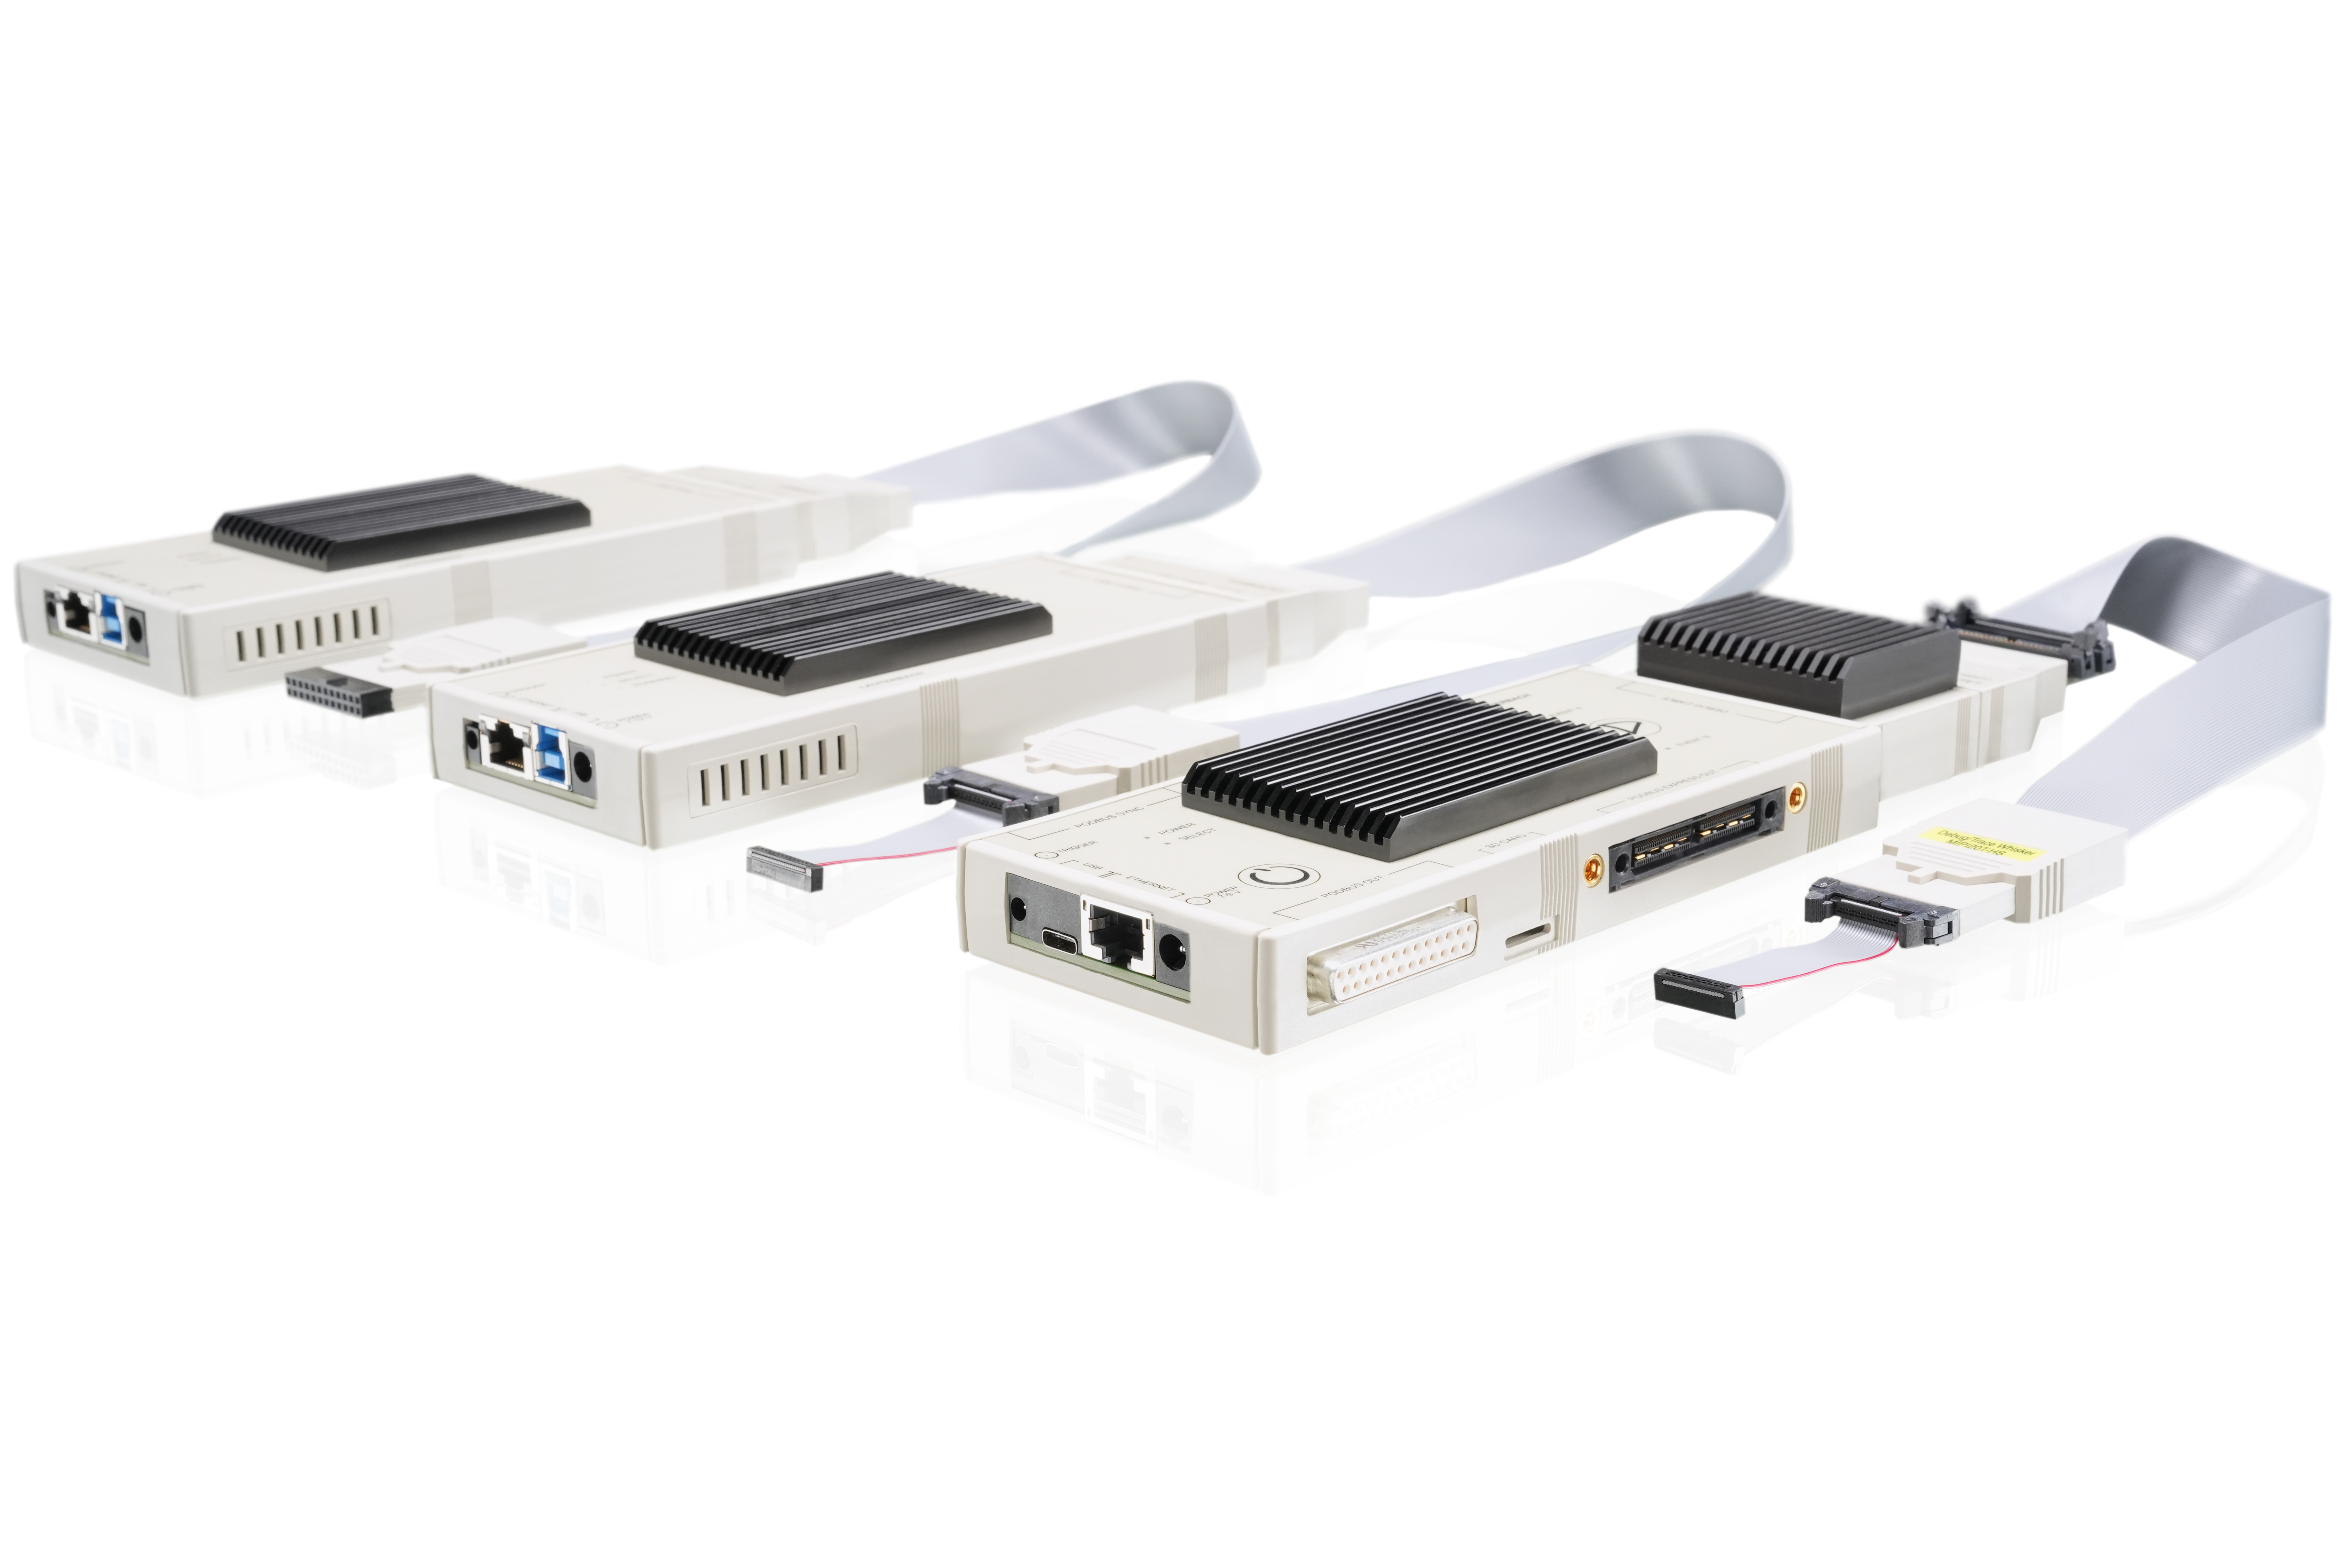
Most cores for the embedded market provide access to on-chip debug features via a debug port. TRACE32® tools connect to this to control the core, access the data being processed by the core and provide developers with debugging over the embedded device: start, stop, step control; reading and writing memory and registers; setting breakpoints; tracking values of variables and so on. This means developers can diagnose software failures and memory corruption issues and correct the system to make it perform as expected.