PowerTrace III



High-Performance Parallel Trace Extension
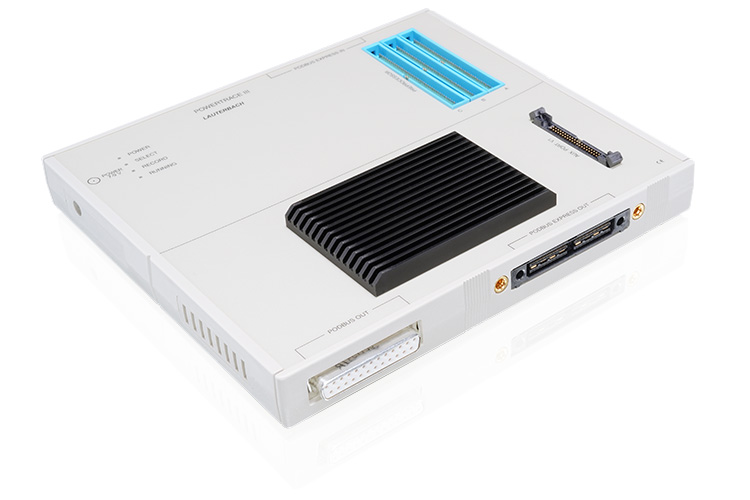
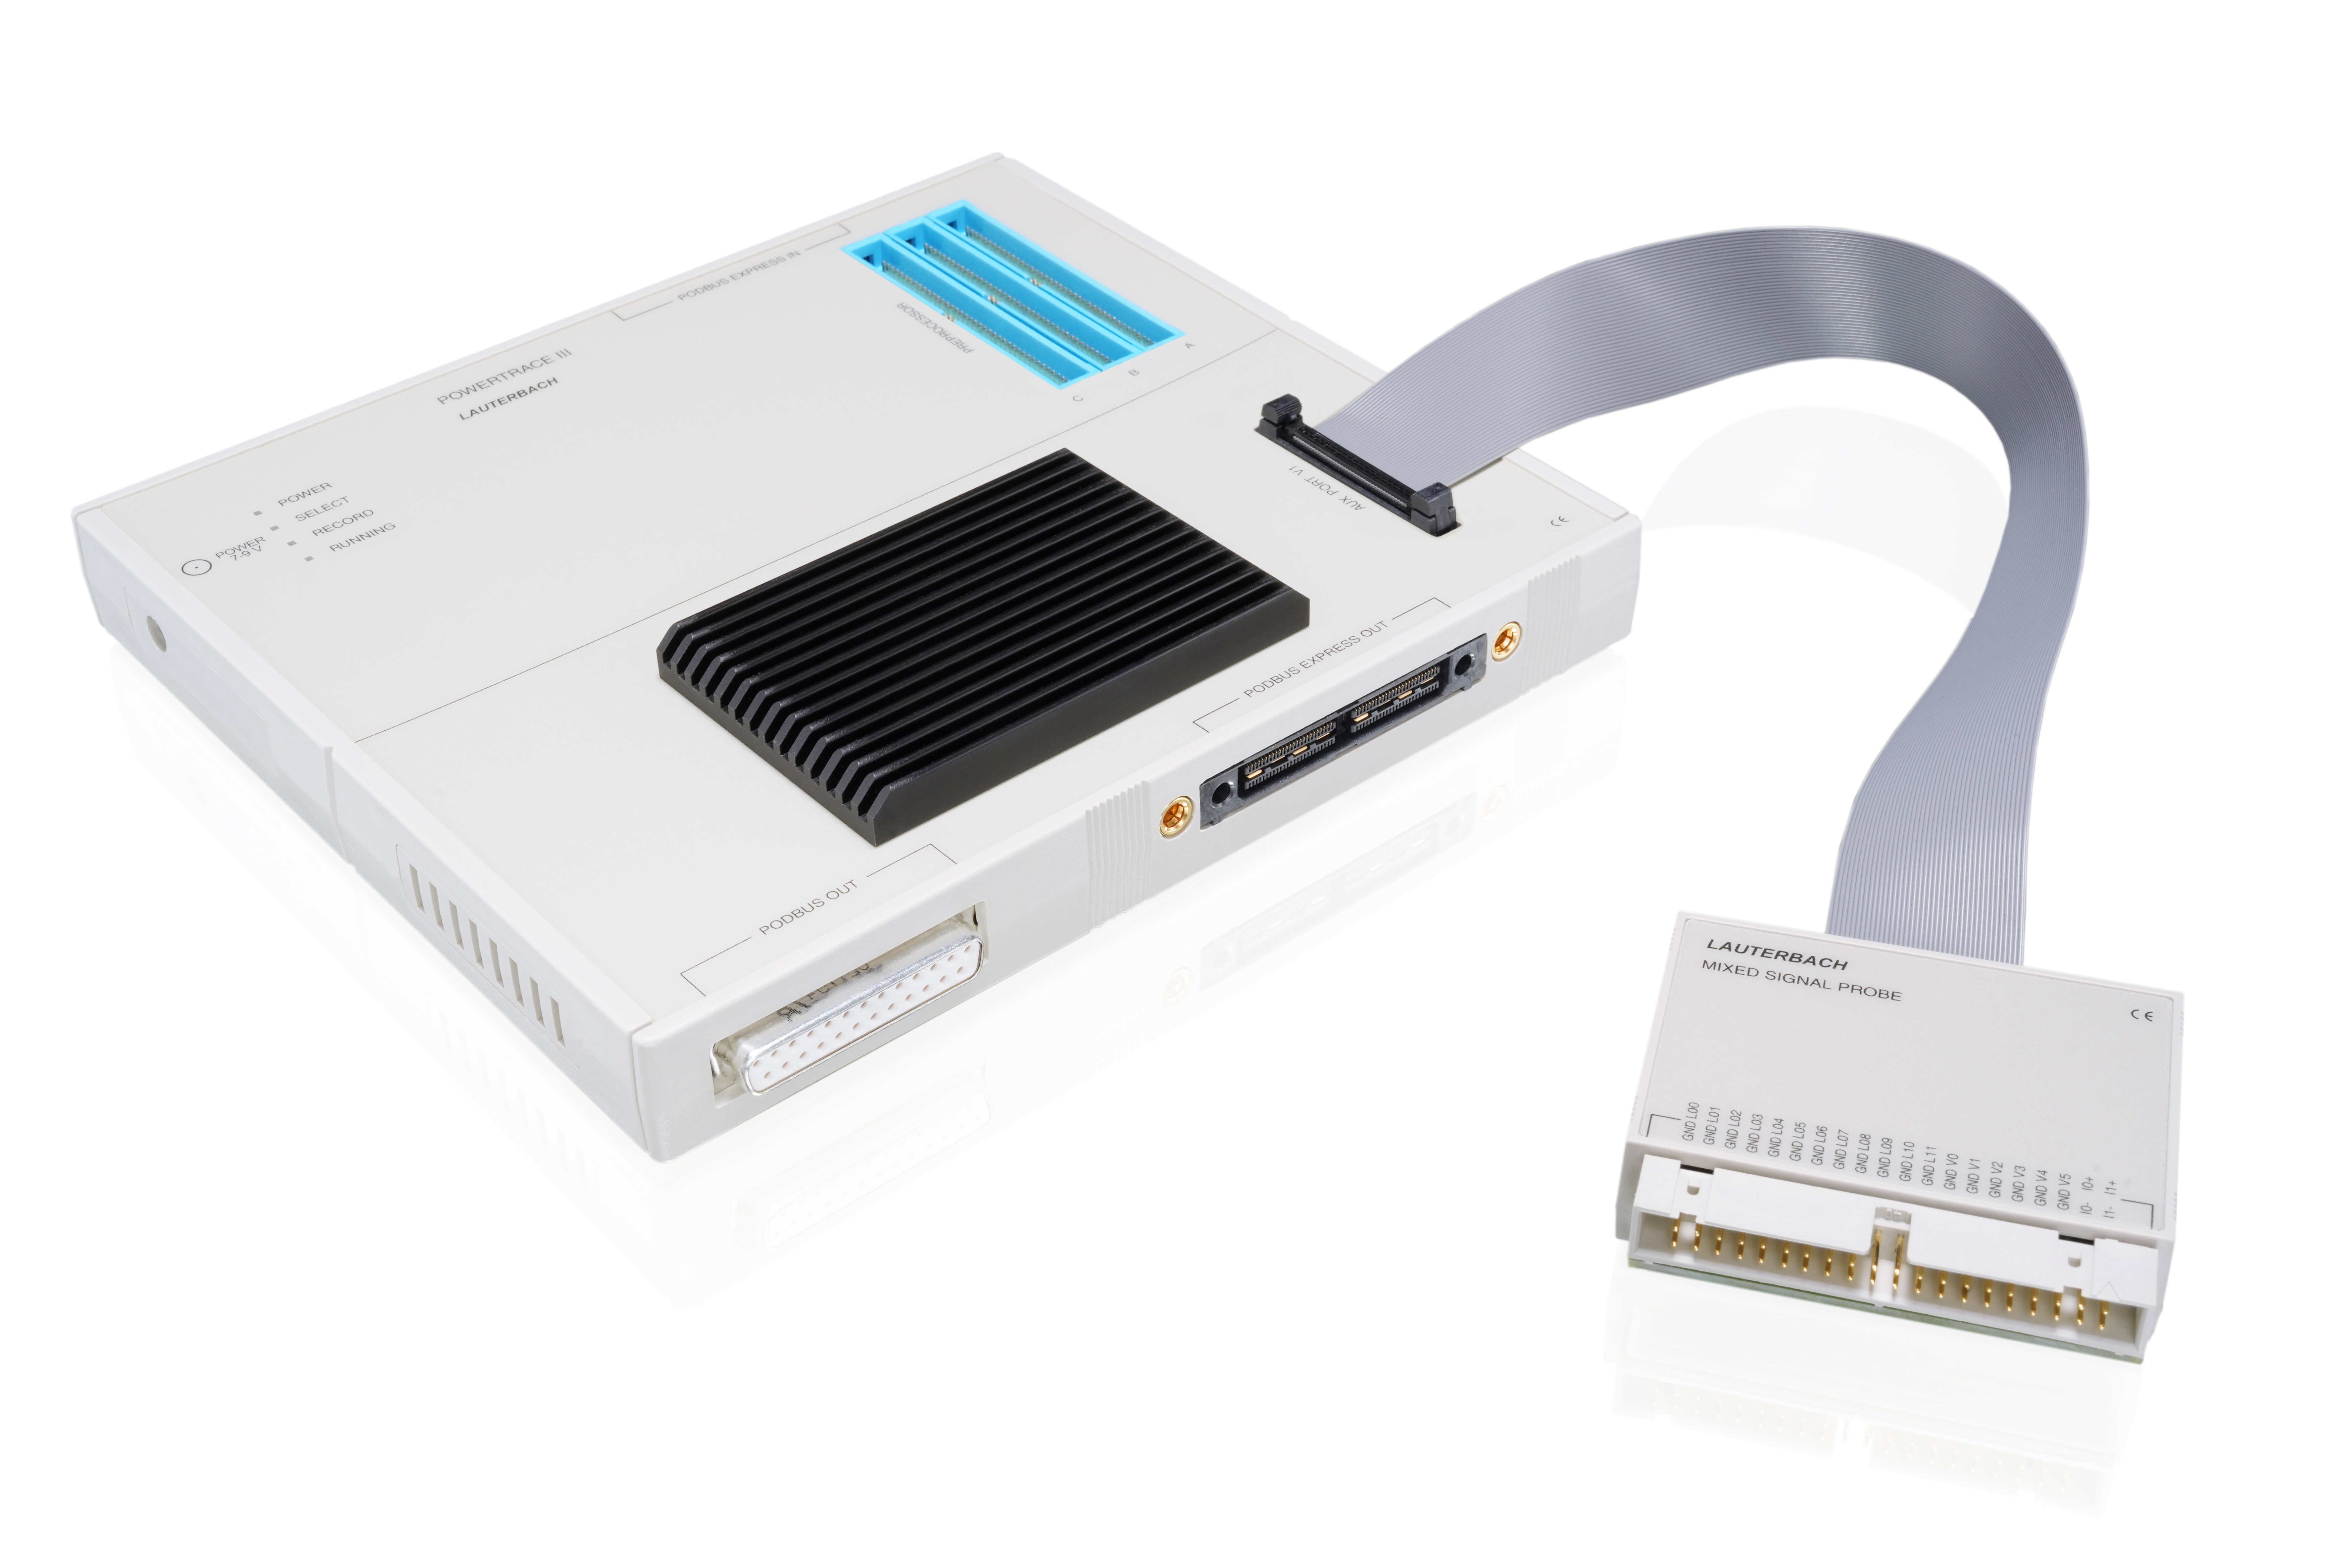
Our high-performance PowerTrace III trace module is the best trace tool available for parallel trace ports, letting you get the maximum data throughput out of your device. With its high speed, large memory buffer, and support of almost any CPU, you are able to record system behavior in real time without influencing the system operation. PowerTrace III uses the PodBus Express port of your existing PowerDebug X51 to expand your system capabilities. Migration to a new architecture requires minimal change due to the modular design of preprocessors and connectors.
Win the Race with Trace
Real-time trace dramatically improves your ability to debug and analyze your embedded system. Embedded projects benefit from measuring execution performance, analyzing race conditions, or proving code coverage. By using PowerTrace III for parallel trace, you will quickly locate and fix bugs to keep up with the ever-hastening development cycle pace. It captures the comprehensive run-time behavior of your embedded system to find glitches even if they only appear in real time.
Keep Up with Modern Multi-Core Devices
Store data from multiple cores simultaneously in the large high-speed buffer (up to 8 GB) of the PowerTrace III. With its maximum recording speed of 19.2 Gbit/s, PowerTrace III is suitable for state-of-the-art and future processor speeds.
Use Any Available Trace Protocol
PowerTrace III can handle a wide range of standard and proprietary trace protocols for both system-level and program flow traces. These include ETM, PTM, Nexus, MCDC, SWV, TWP, STP and more.
Ultra-Long Trace Lets You Capture Everything
Capture extremely long-term trace recordings by streaming trace data to your host PC for later analysis. An average streaming rate of 400 MB/s ensures reliable transfer without data loss. Even higher trace rates may be achieved and are handled reliably by the PowerTrace III internal high-speed memory buffer.
Trace Outside The Box
PowerTrace III provides a complete view of your embedded system beyond the confines of your SoC core. The Mixed-Signal Probe augments your PowerTrace III by recording external digital and analog signals and correlating them exactly to the traced program execution. This provides crucial insight into any external, real-time behavior that affects your code execution.
Compare Trace Extensions
This product |
||||
 |
 |
 |
 |
|
| Product | PowerTrace Serial 2 | PowerTrace III |
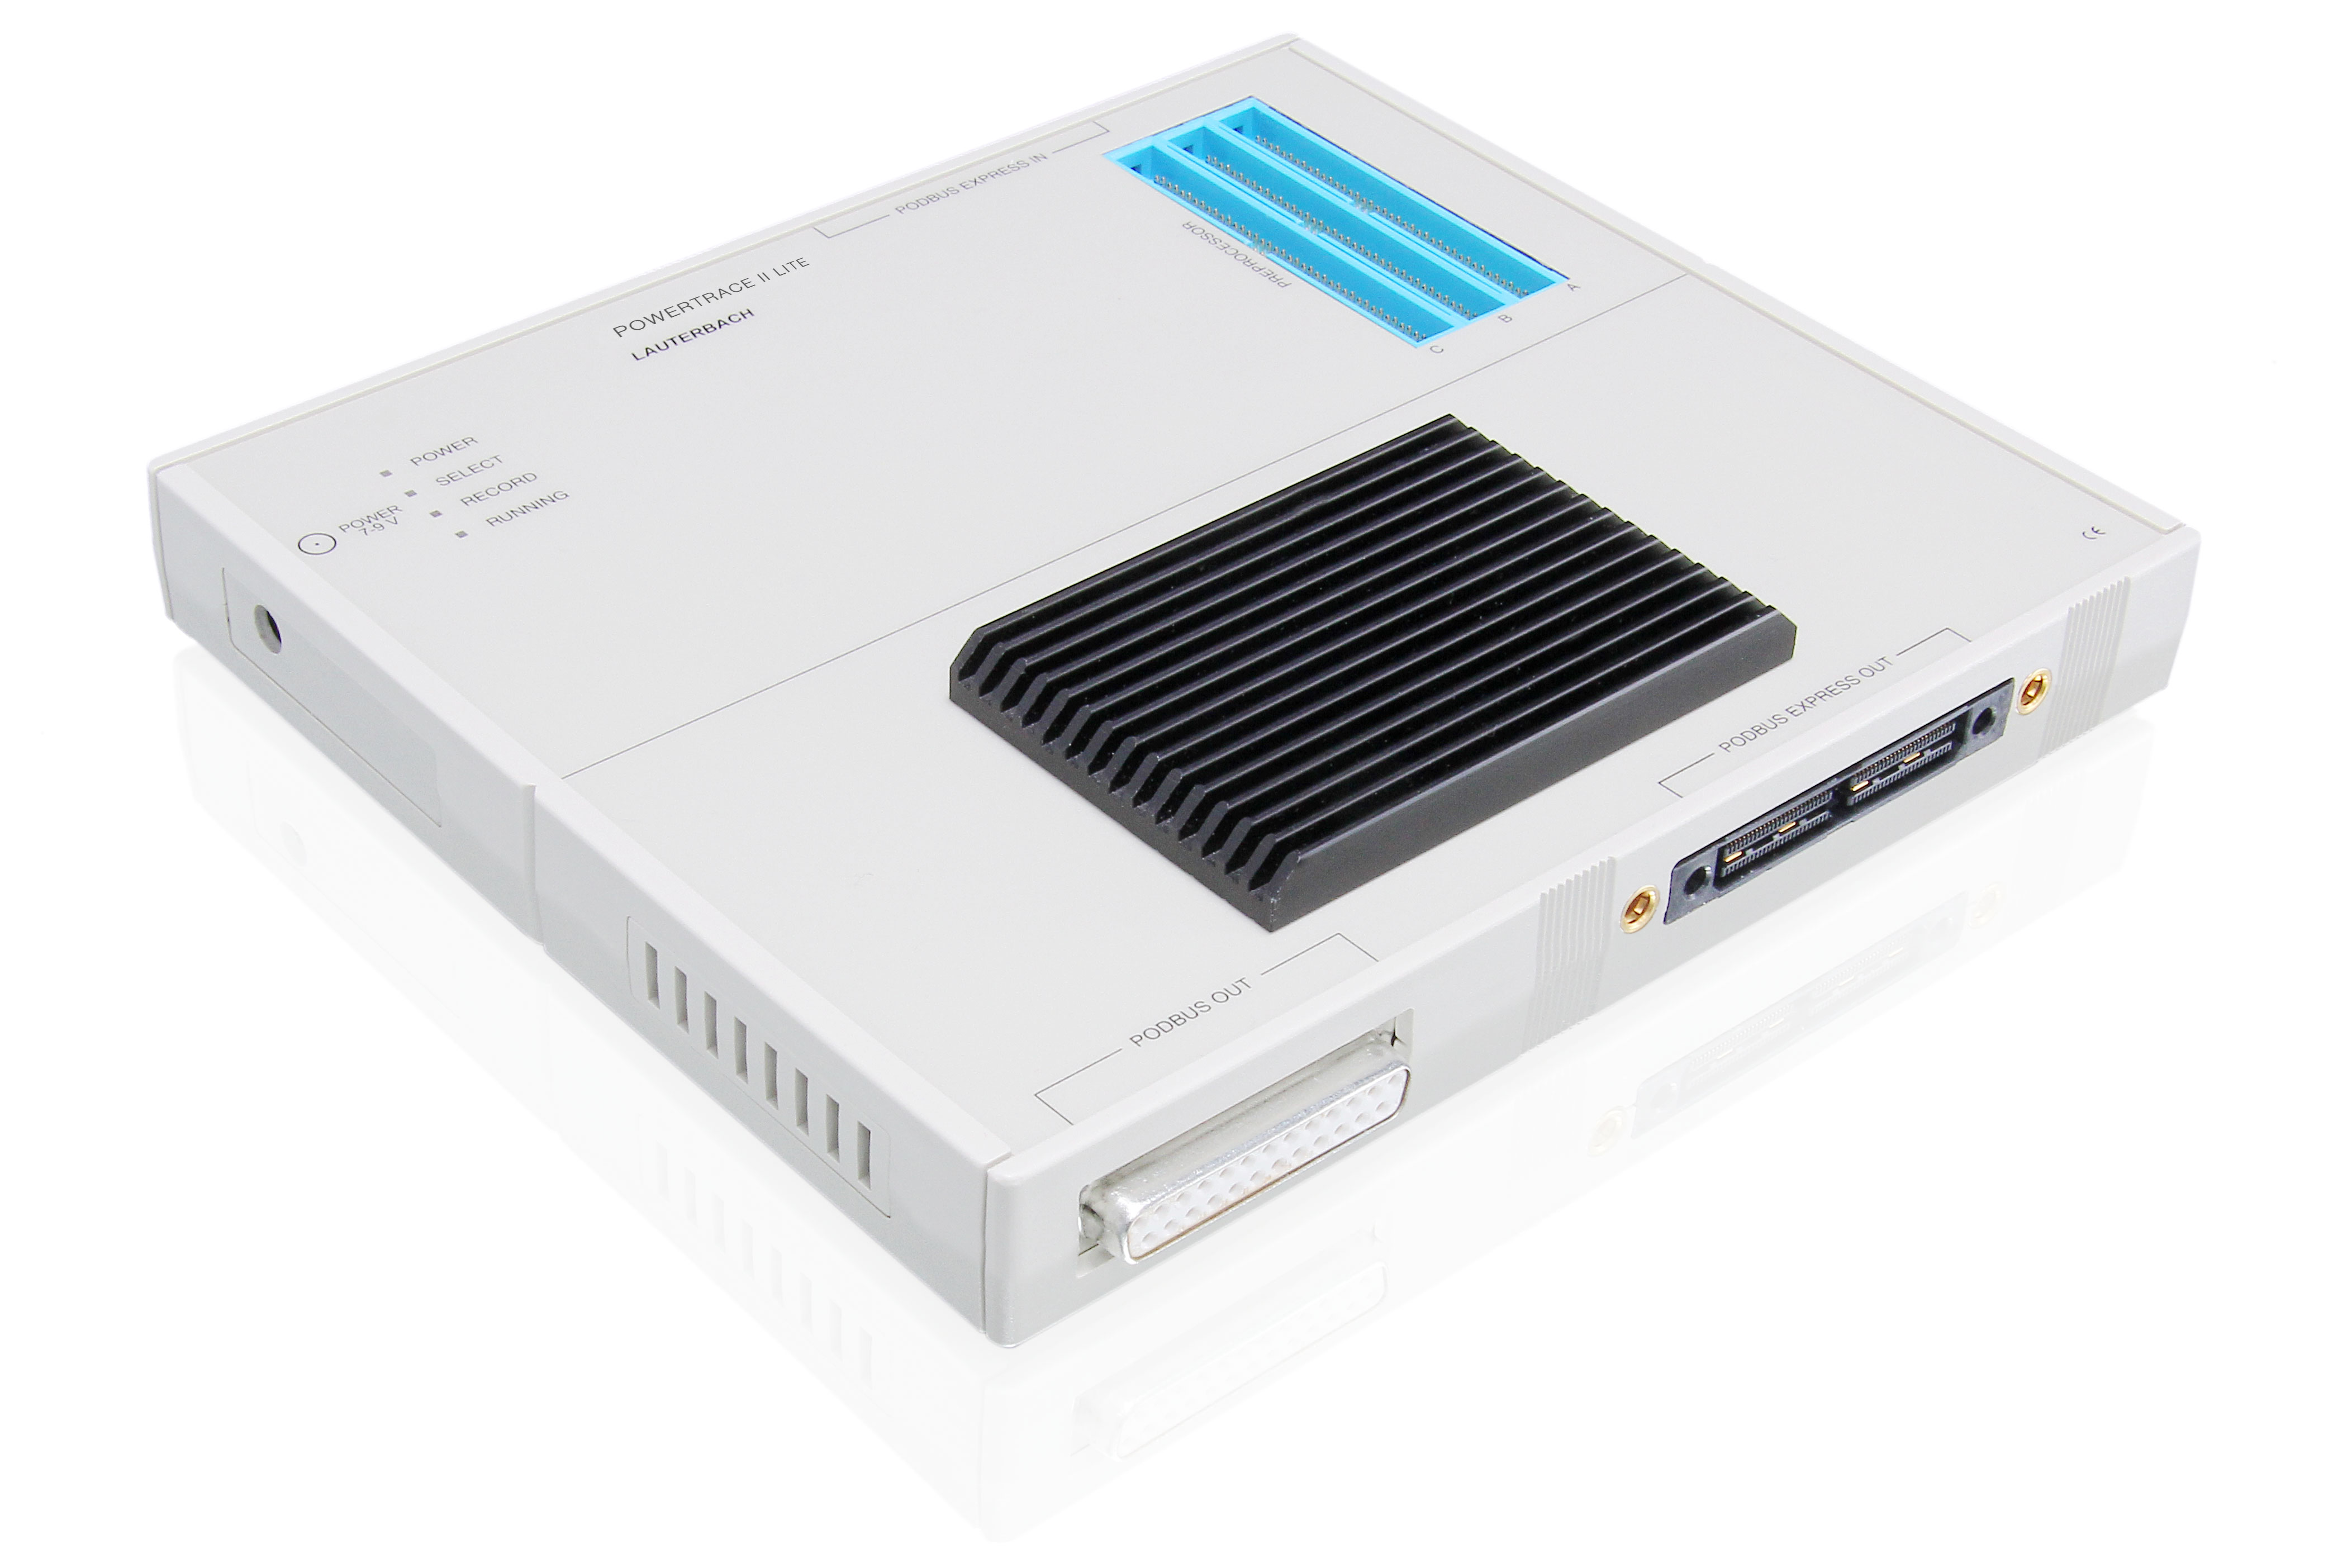
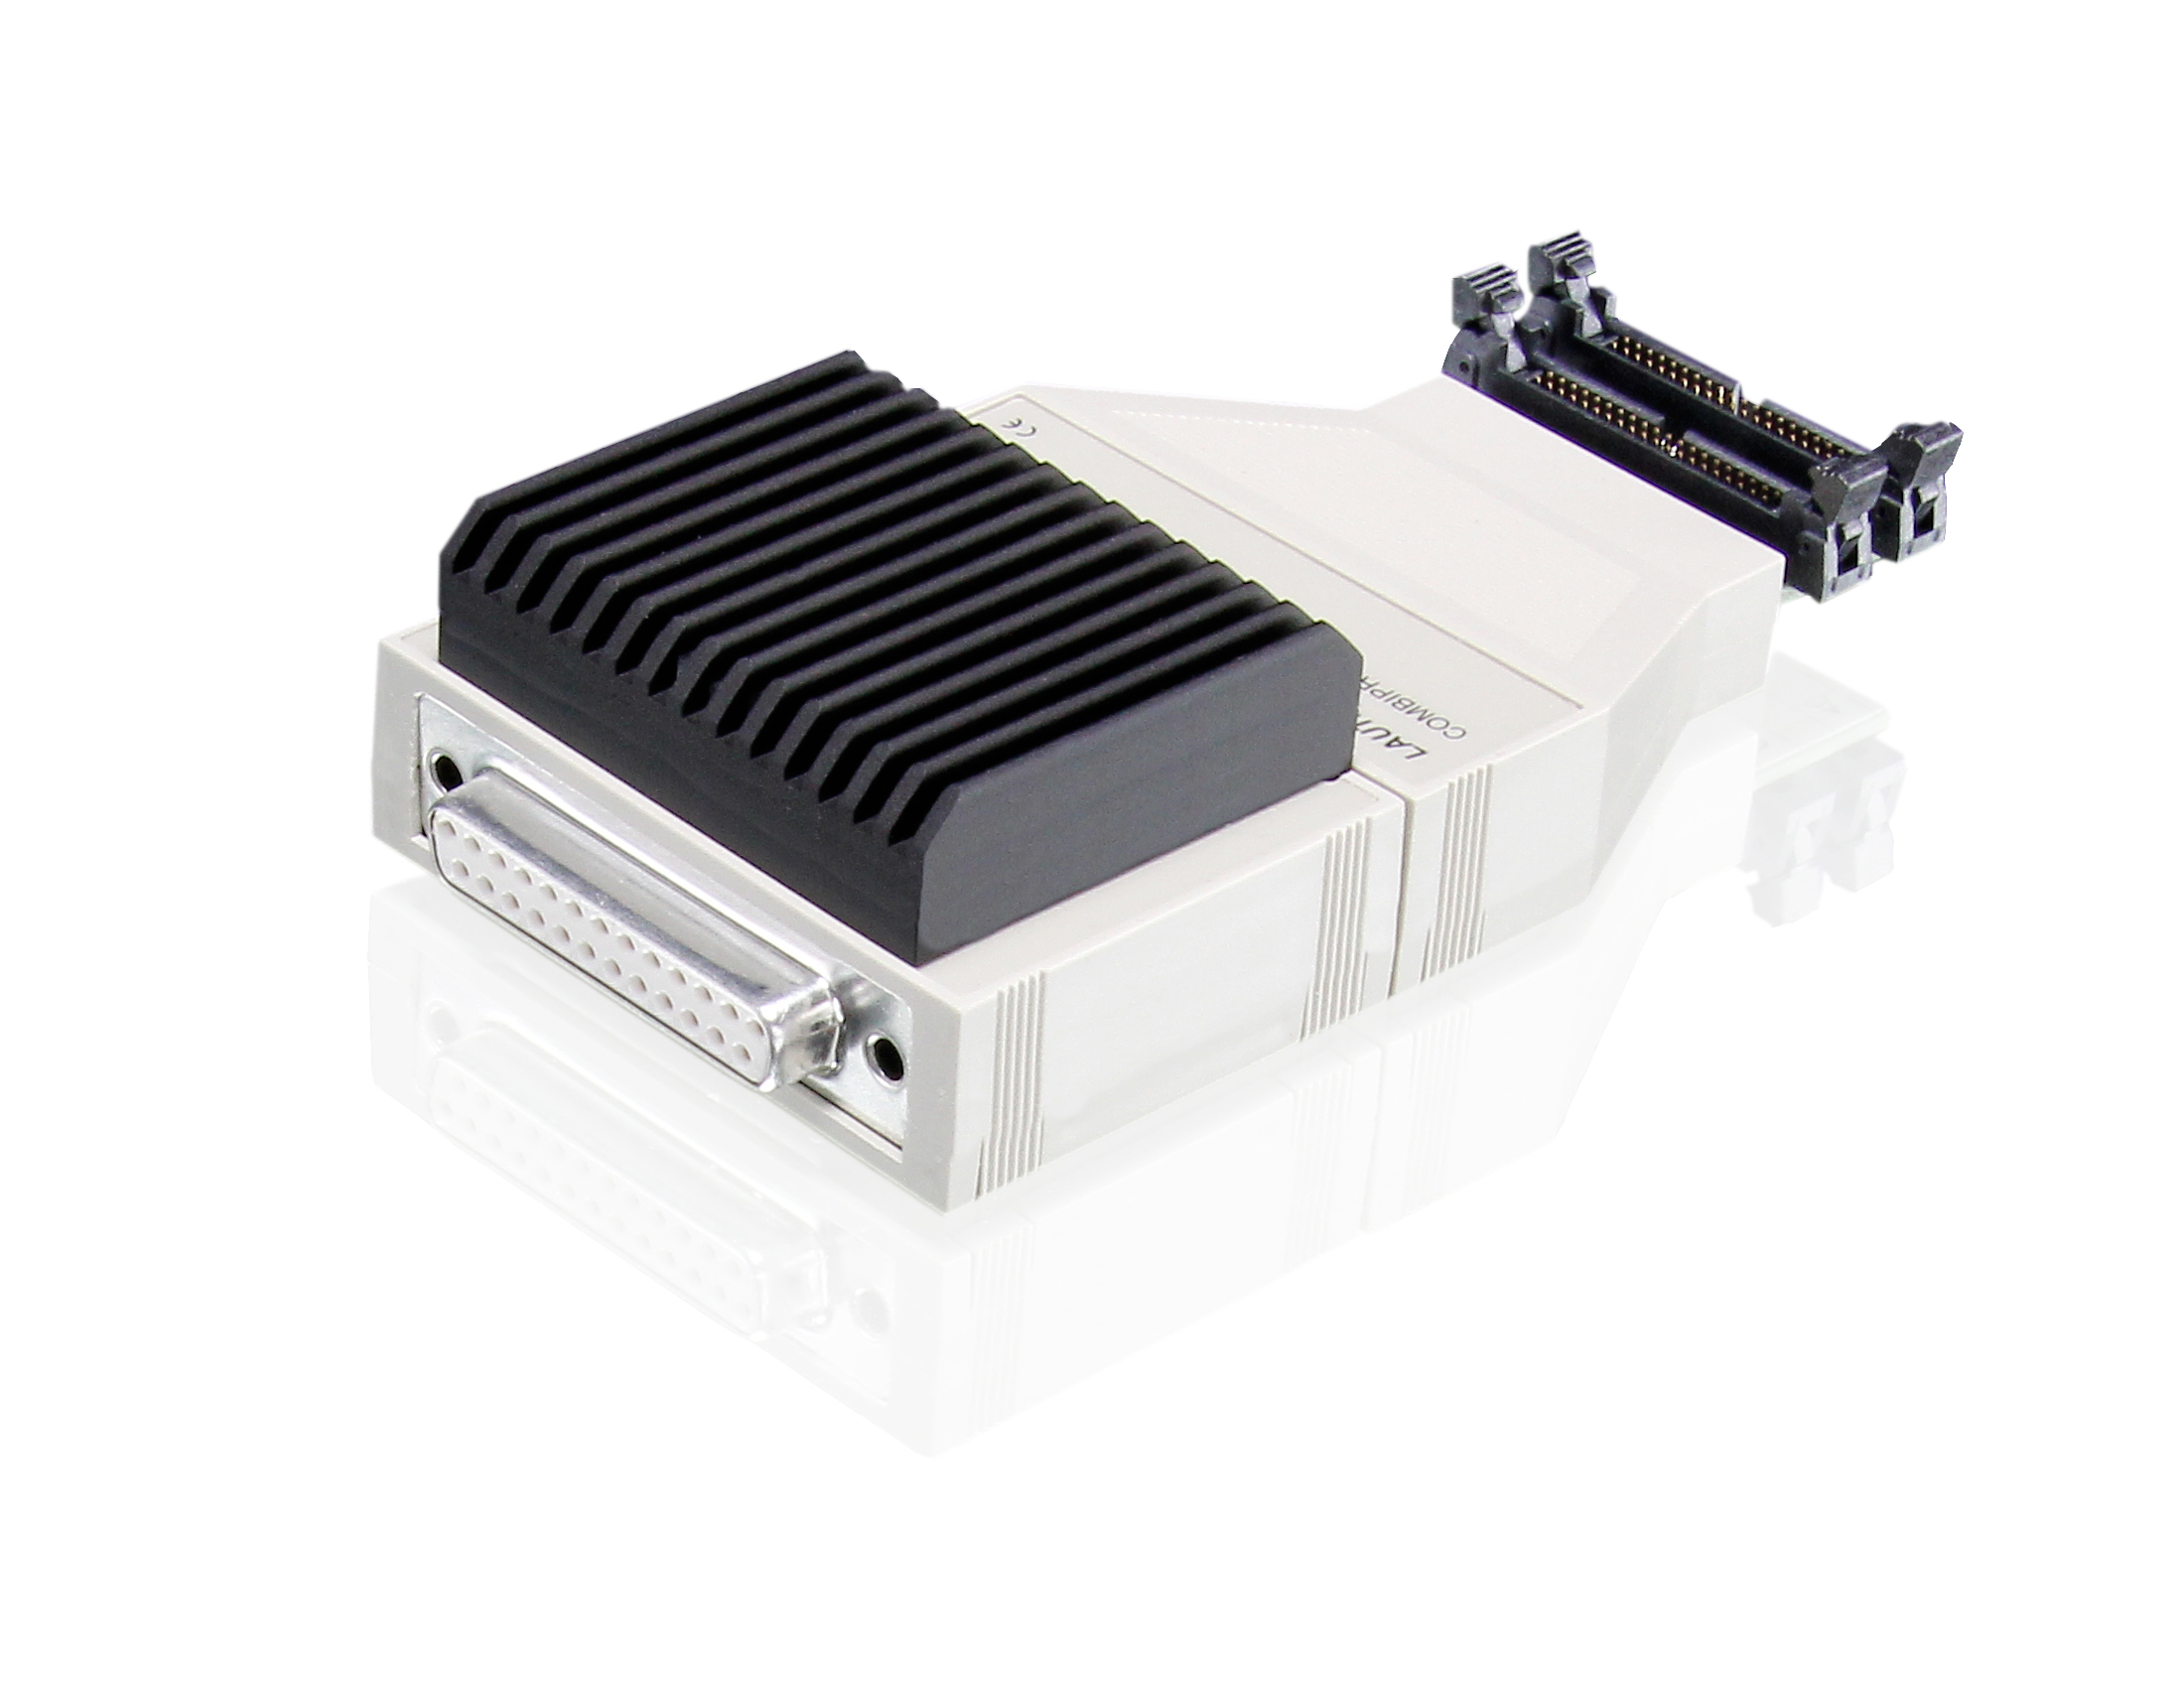
PowerTrace II Lite | CombiProbe 2 |
| Memory Size | 4 GByte or 8 GByte | 4 GByte or 8 GByte | 1 GByte | 512 MByte |
| Application | High-performance serial tracing | High-performance parallel tracing | Parallel tracing | Debugging and system trace |
| Maximum Bandwidth | 80 Gbit/s | 19.2 Gbit/s | 10.8 Gbit/s | 3.2 Gbit/s |
| Streaming Performance 4 (Peak / Average) |
10 000 / 400 MByte/s | 2 400 / 400 MByte/s | 1 350 / 100 MByte/s | 200 / 140 MByte/s |
| Parallel Trace1 | N/A | Up to 36 lines 600+ Mbit/s per line @ 17 lines 350 Mbit/s per line @ 36 line |
Up to 36 lines 600+ Mbit/s per line @ 9 lines 450 Mbit/s per line @ 17 lines 225 Mbit/s per line @ 36 lines |
Two ports with up to 4 lines each 400 Mbit/s per line |
| Serial Trace | Up to 8 lanes with 2 12.5 Gbit/s per lane @ 8 lanes 22.5 Gbit/s per lane @ 4 lanes 7 PCIe Gen.2/3 x8, PCIe Gen.4 x48 |
Up to 4 lanes2,3 6.25 Gbit/s per lane @ 3 lanes 5.00 Gbit/s per lane @ 4 lanes |
Up to 4 lanes2,3 6.25 Gbit/s per lane @2 lanes 4.50 Gbit/s per lane @3 lanes 3.38 Gbit/s per lane @ 4 lanes |
N/A |
| Option for logic analyzer and energy profiling | Via Mixed-Signal Probe | Via Mixed-Signal Probe | Not Available | Via Mixed-Signal Probe |
| Required debug module | PowerDebug X516 | PowerDebug X516 | PowerDebug X516 | Any PowerDebug5 |
| See more | See more | See more |
1The average streaming rate defines the amount of data which can be transferred on the fly to the PC per second. If the trace-port rate is below that streaming rate in average, a practically infinite recording time is possible. The peak-rate is possible temporarily and is compensated by the internal memory of the PowerTrace extension.
2We specify here the speed of the serial link. The maximum speed for the transferred payload is usually smaller due to line encoding, e.g. 80 % with 8b/10b encoding.
3 Requires serial preprocessor. For serial tracing we recommend PowerTrace Serial.
4The streaming rate defines the amount of data which can be transferred on the fly to the PC per second. If the trace-port rate is below the streaming rate in average, a practically infinite recording time is possible.
5 CombiProbe 2 works with PowerDebug E50, X50, X51, E40, PRO, USB 3, II. Not supported are PowerDebug Ethernet, USB, or USB 2.
6 PowerTrace extensions work with PowerDebug X50, X51, PRO, II.
7Requires Preprocessor
8PCIe Gen.4 (16 Gbit/s) requires Preprocessor (available in Q2/2023).
Choose your PowerTrace III package
Universal Trace Port Recorder with 4 GigaByte trace memory and a streaming rate up to 400 MByte/s. Supports parallel trace for up to 36 signals via a suitable preprocessor with the following maximum recording speed: 600+ Mbit/s per signal for 17 signals, 350 Mbit/s per signal for 36 signals. Supports serial trace for up to 4 lanes via a serial preprocessor with the following maximum recording speed: 6.25 Gbit/s per lane for 3 lanes, 5.00 Gbit/s per lane for 4 lanes. Requires a suitable trace preprocessor or Nexus Adapter. Requires PowerDebug X51/X50, PowerDebug PRO, or PowerDebug II. Requires TRACE32 software DVD 2021/02 or newer. Can be extended with a Mixed-Signal-Probe (LA-2500).
Universal Trace Port Recorder with 8 GigaByte trace memory and a streaming rate up to 400 MByte/s. Supports parallel trace for up to 36 signals via a suitable preprocessor with the following maximum recording speed: 600+ Mbit/s per signal for 17 signals, 350 Mbit/s per signal for 36 signals. Supports serial trace for up to 4 lanes via a serial preprocessor with the following maximum recording speed: 6.25 Gbit/s per lane for 3 lanes, 5.00 Gbit/s per lane for 4 lanes. Requires a suitable trace preprocessor or Nexus Adapter. Requires PowerDebug X51/X50, PowerDebug PRO, or PowerDebug II. Requires TRACE32 software DVD 2021/02 or newer. Can be extended with a Mixed-Signal-Probe (LA-2500).
Package of PowerTrace-III Universal Trace Port Controller, and Mixed-Signal Probe Digital/Analog 40-pin connector Characteristics of digital probe 12 channels (12 data) 0..5 V Input 200 MSamples per channel Characteristics of analog probe 6 Channels -12V..+12V 13 bit resolution, 2 current sense channels, Conversion rate 1 MSample/s requires PowerDebug II Ethernet or PowerDebug PRO and TRACE32 software DVD 2021/02 or newer Recommended accessories: LA-6470 Clip Set (Cable and Clips)
Maximize Bandwidth with Autofocus Technology
To connect your target’s trace port to the PowerTrace III, you need a platform-specific trace probe, because trace ports come in all shapes and sizes. Depending on your use case, a trace probe for the PowerTrace III is called a Preprocessor or Nexus Adapter.
Our Preprocessor’s AutoFocus technology automatically adjusts the sampling point for every signal of your parallel trace port independently from one another. This results in more reliable trace capture with less concern about board routing and length matching.

Configuration Examples for PowerTrace III
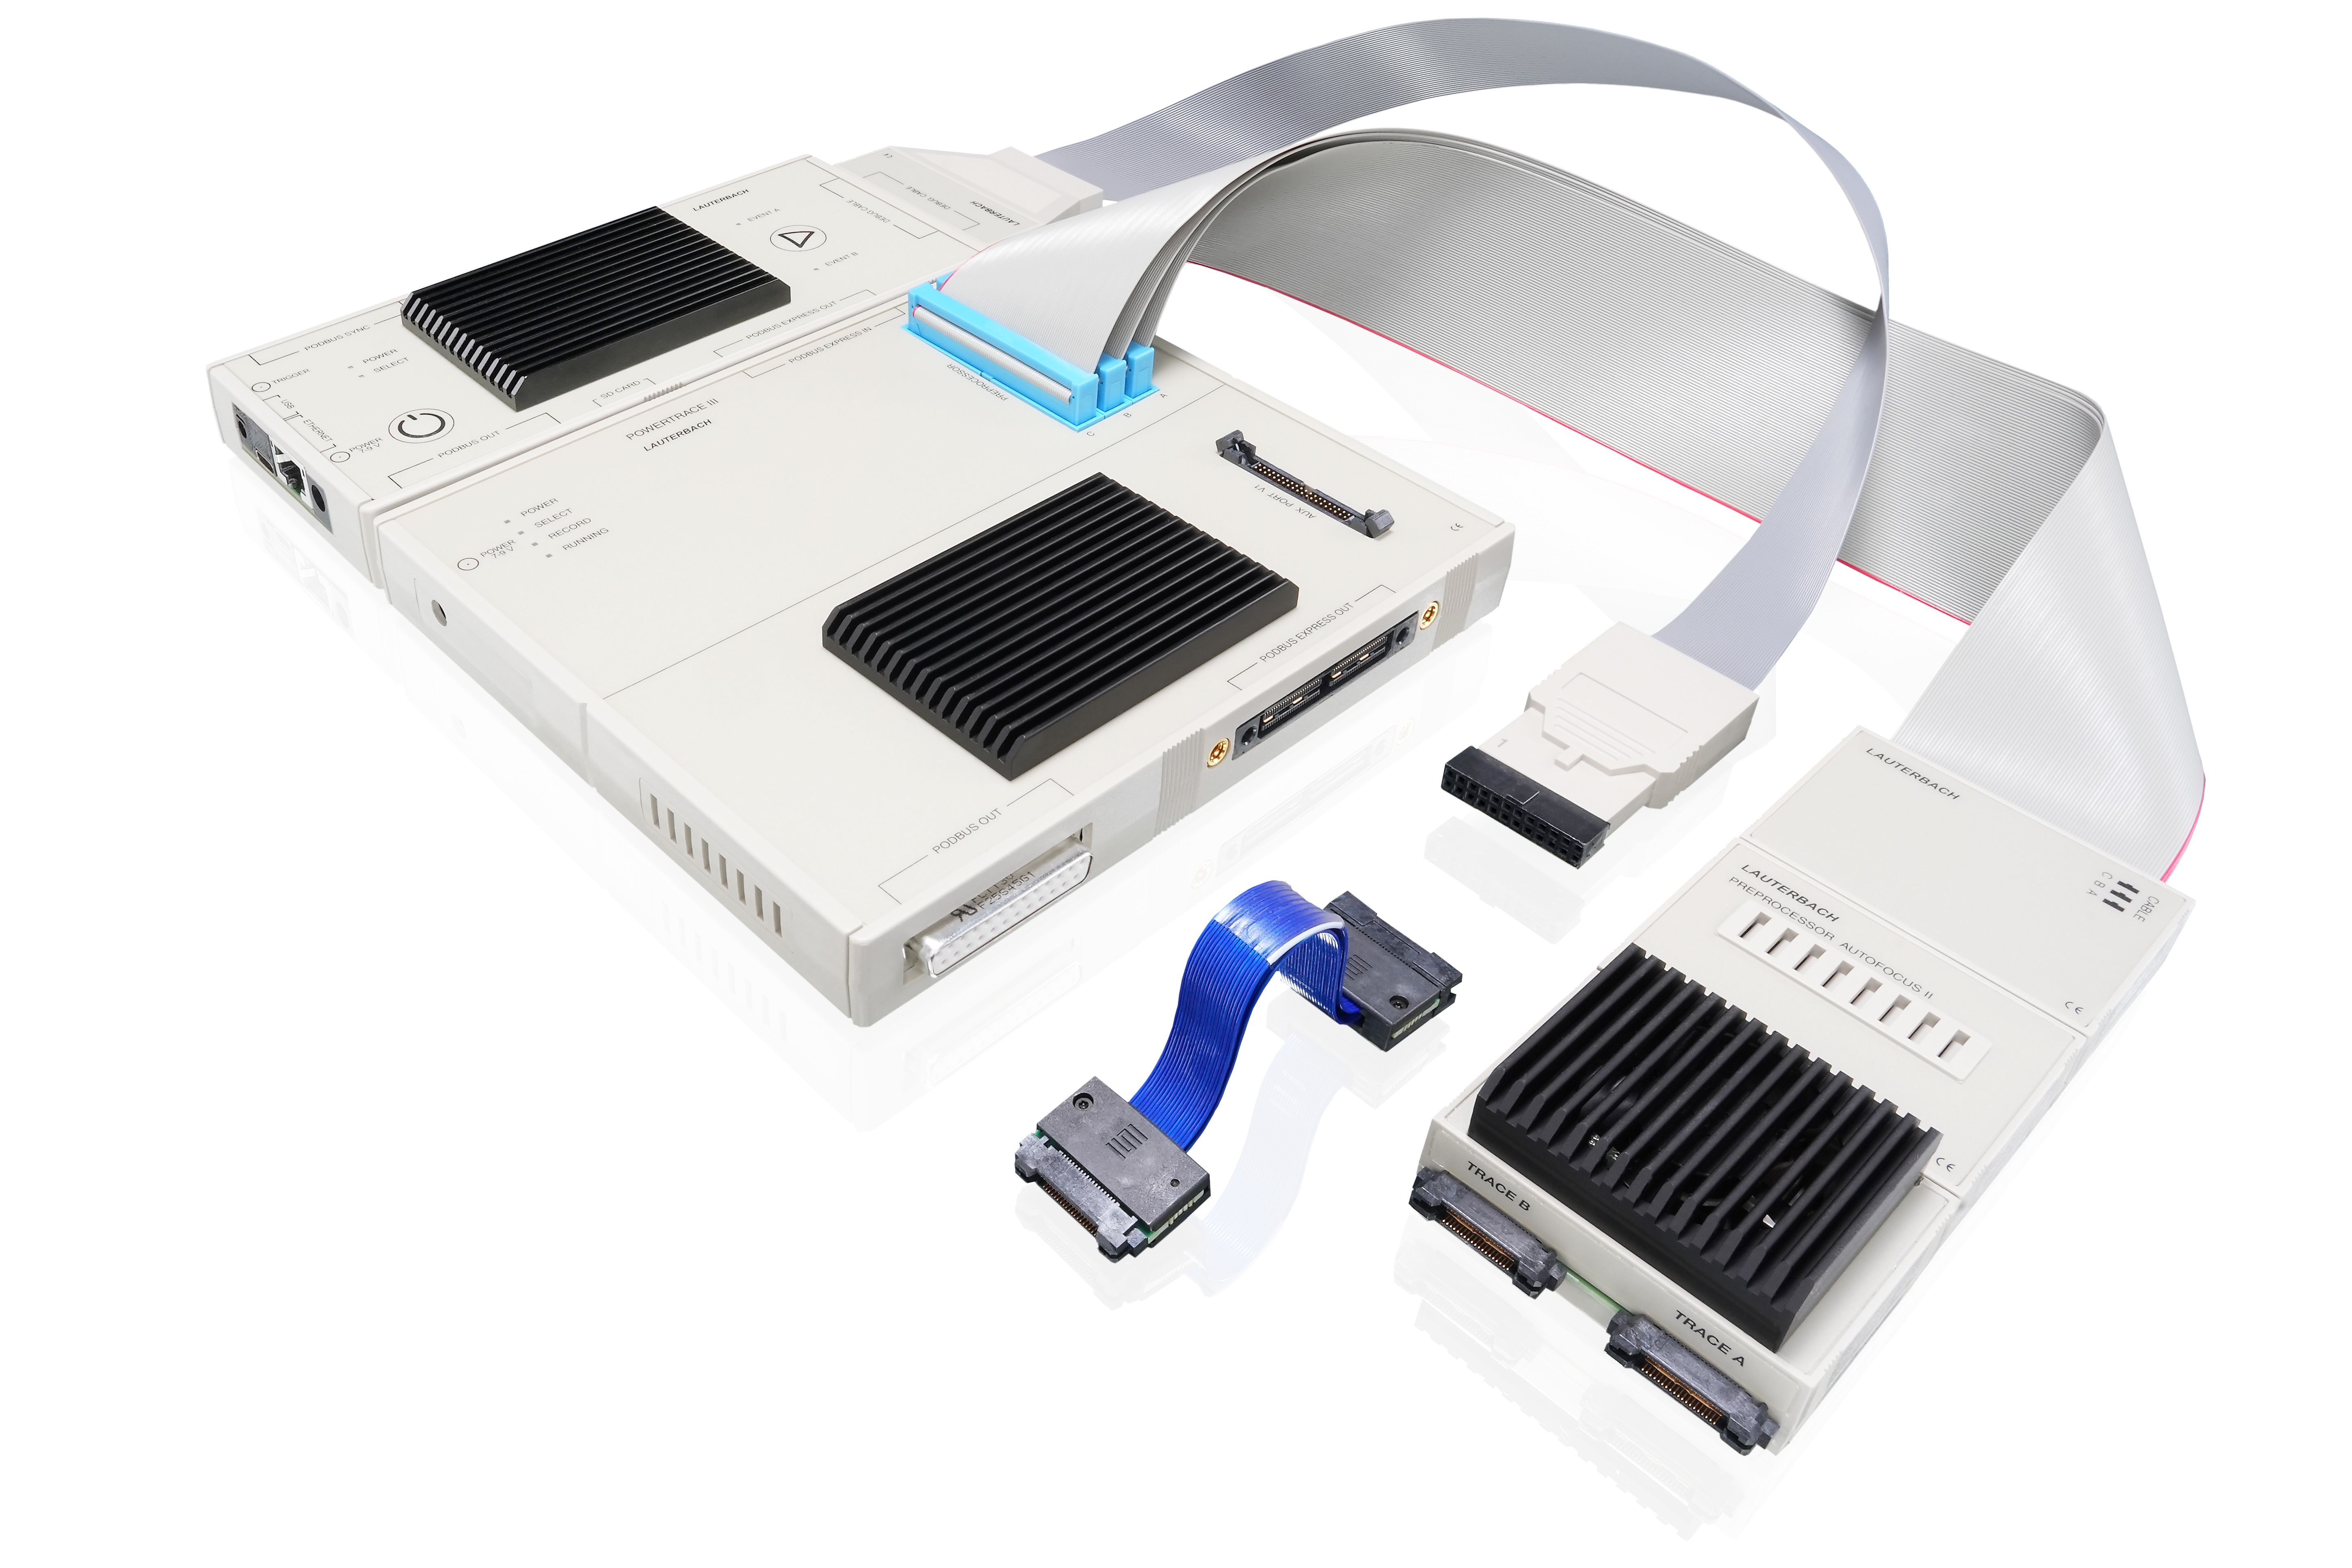
Arm Parallel Trace
Capture Arm CoreSight™ Trace to investigate code execution and data accesses, provided on a MICTOR 38 connector. For parallel trace ports wider than 16 bits, you can connect a second cable to the Preprocessor.
Products included:
- PowerDebug X51
- PowerTrace III
- Debug Probe IDC20A
- Preprocessor AutoFocus II
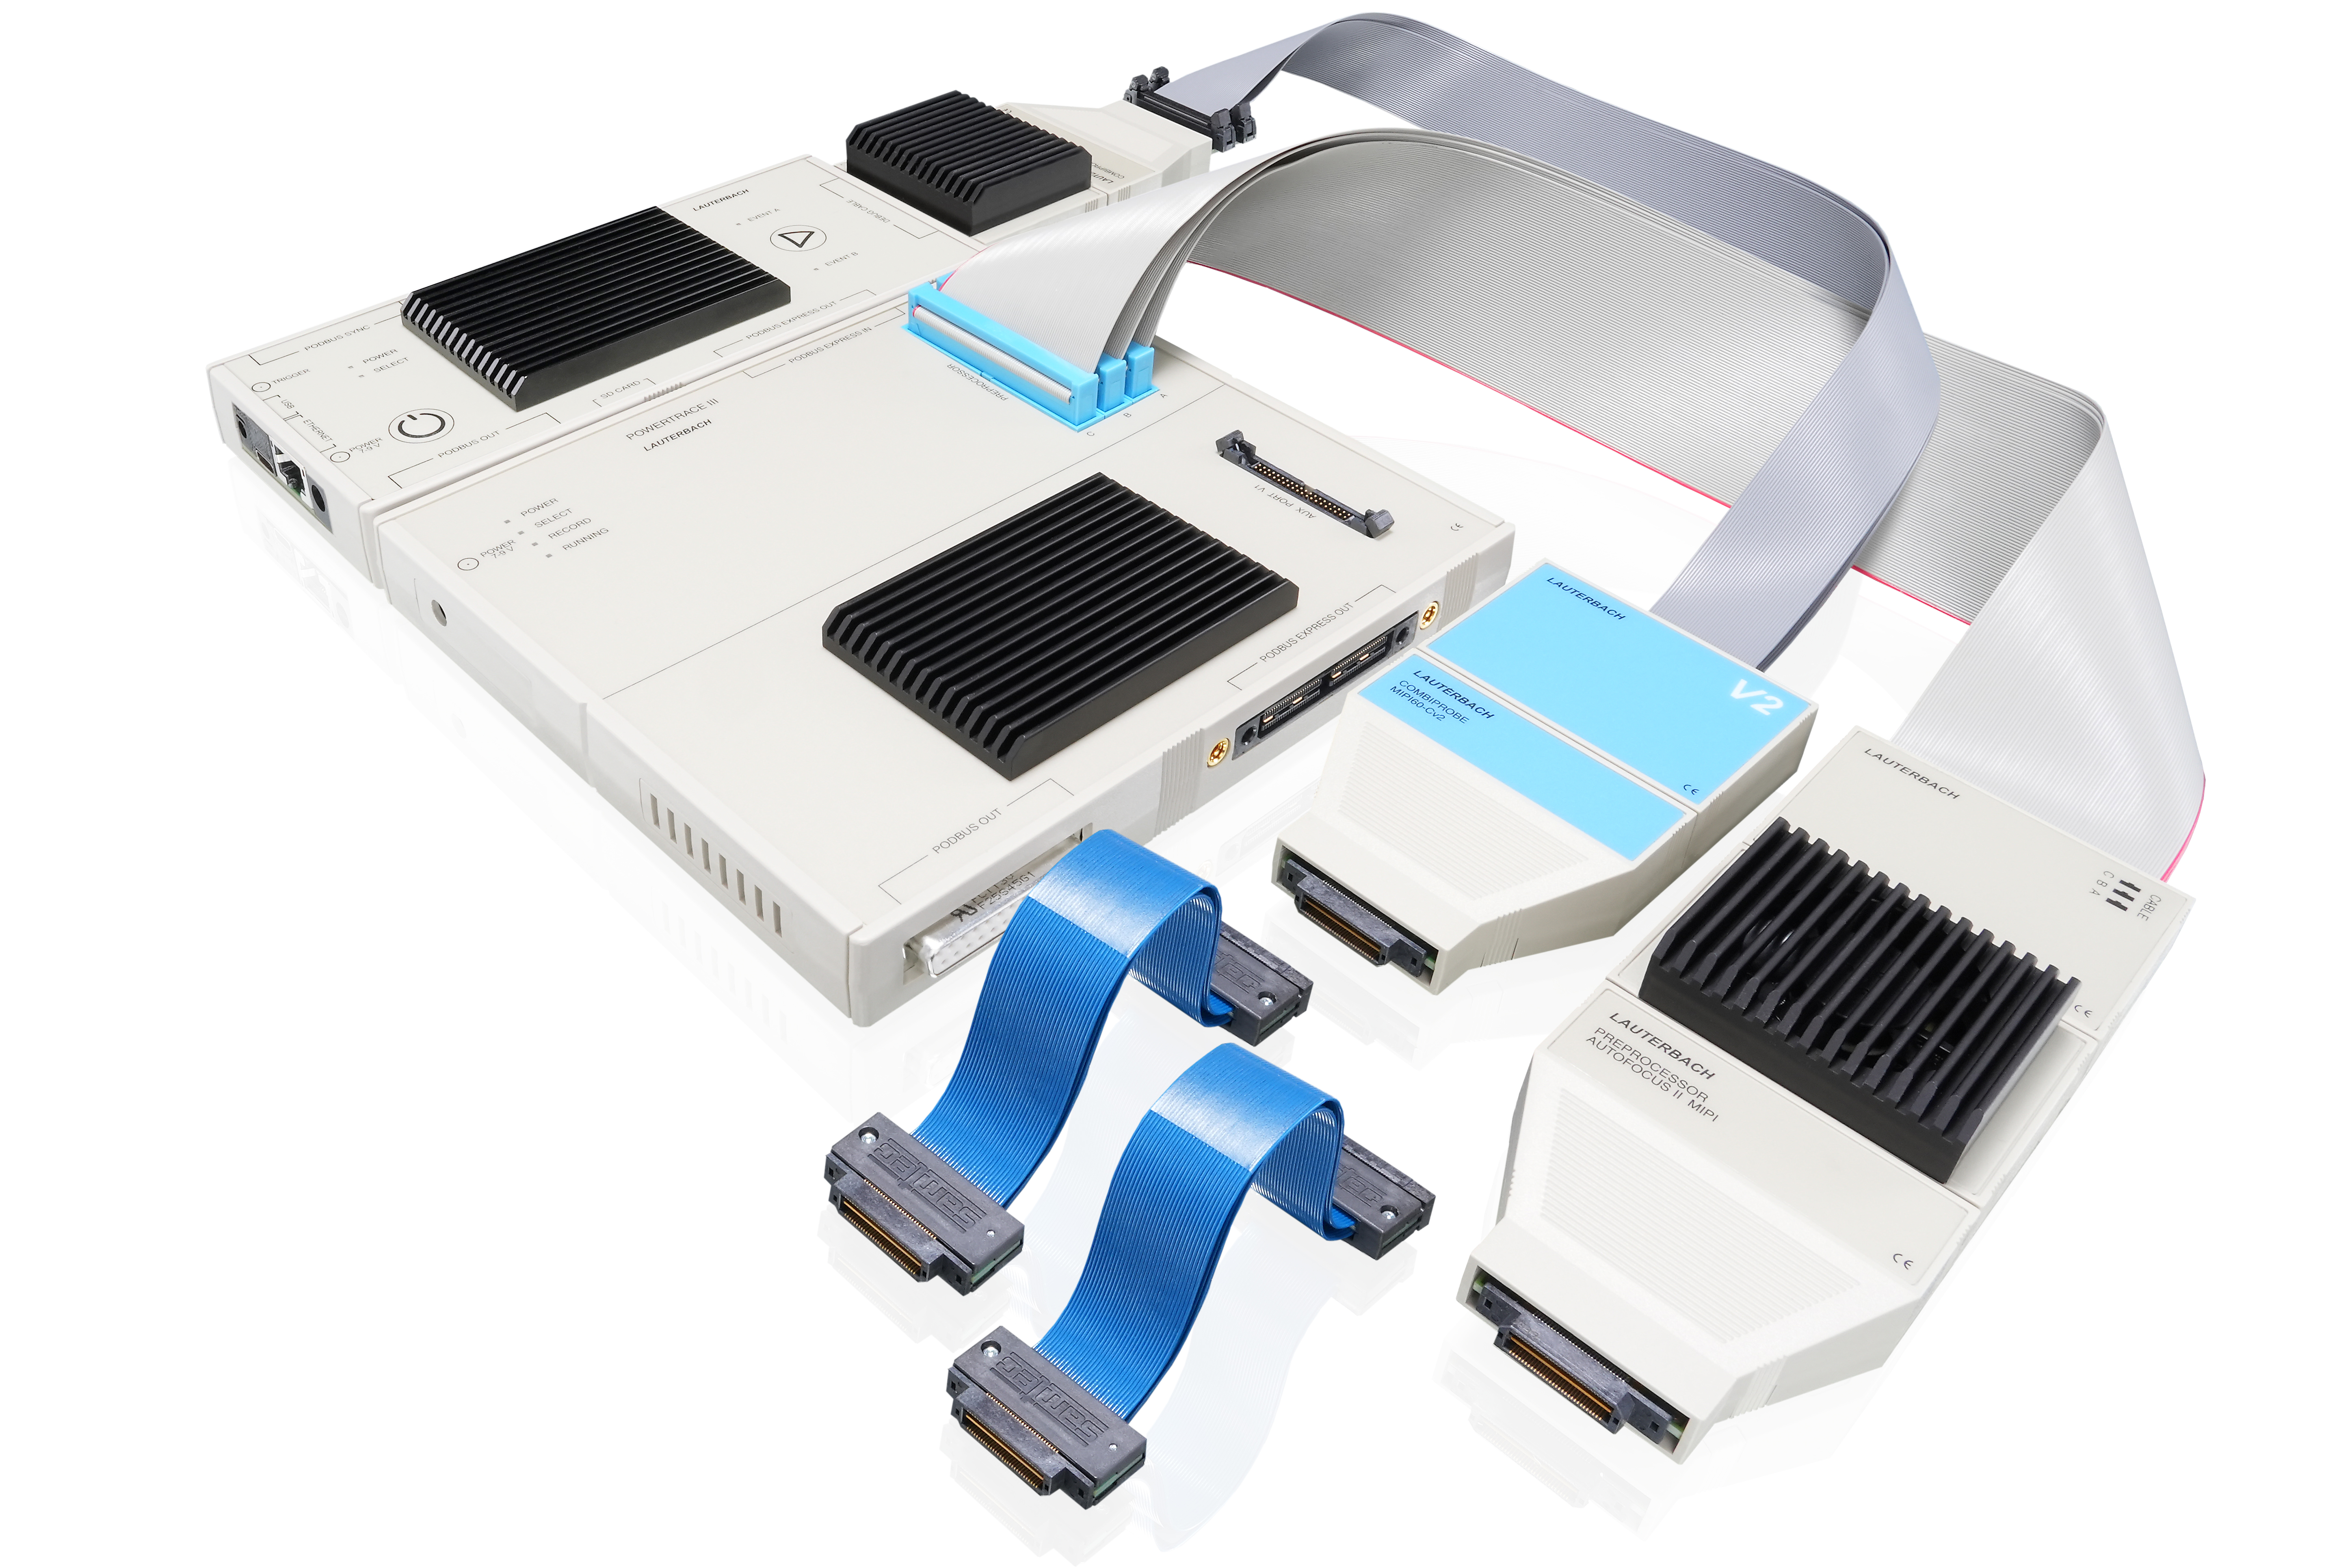
MIPI Parallel Trace
Capture trace in MIPI System Trace Protocol (STP) or MIPI Trace Wrapper Protocol (TWP) from a MIPI-60 trace port. The 60-pin QTH/QSH connection supports up to 36 parallel trace signals via one single connector.
Products included:
- PowerDebug X51
- PowerTrace III
- CombiProbe
- Whisker MIPI60-Cv2
- Preprocessor AutoFocus II MIPI
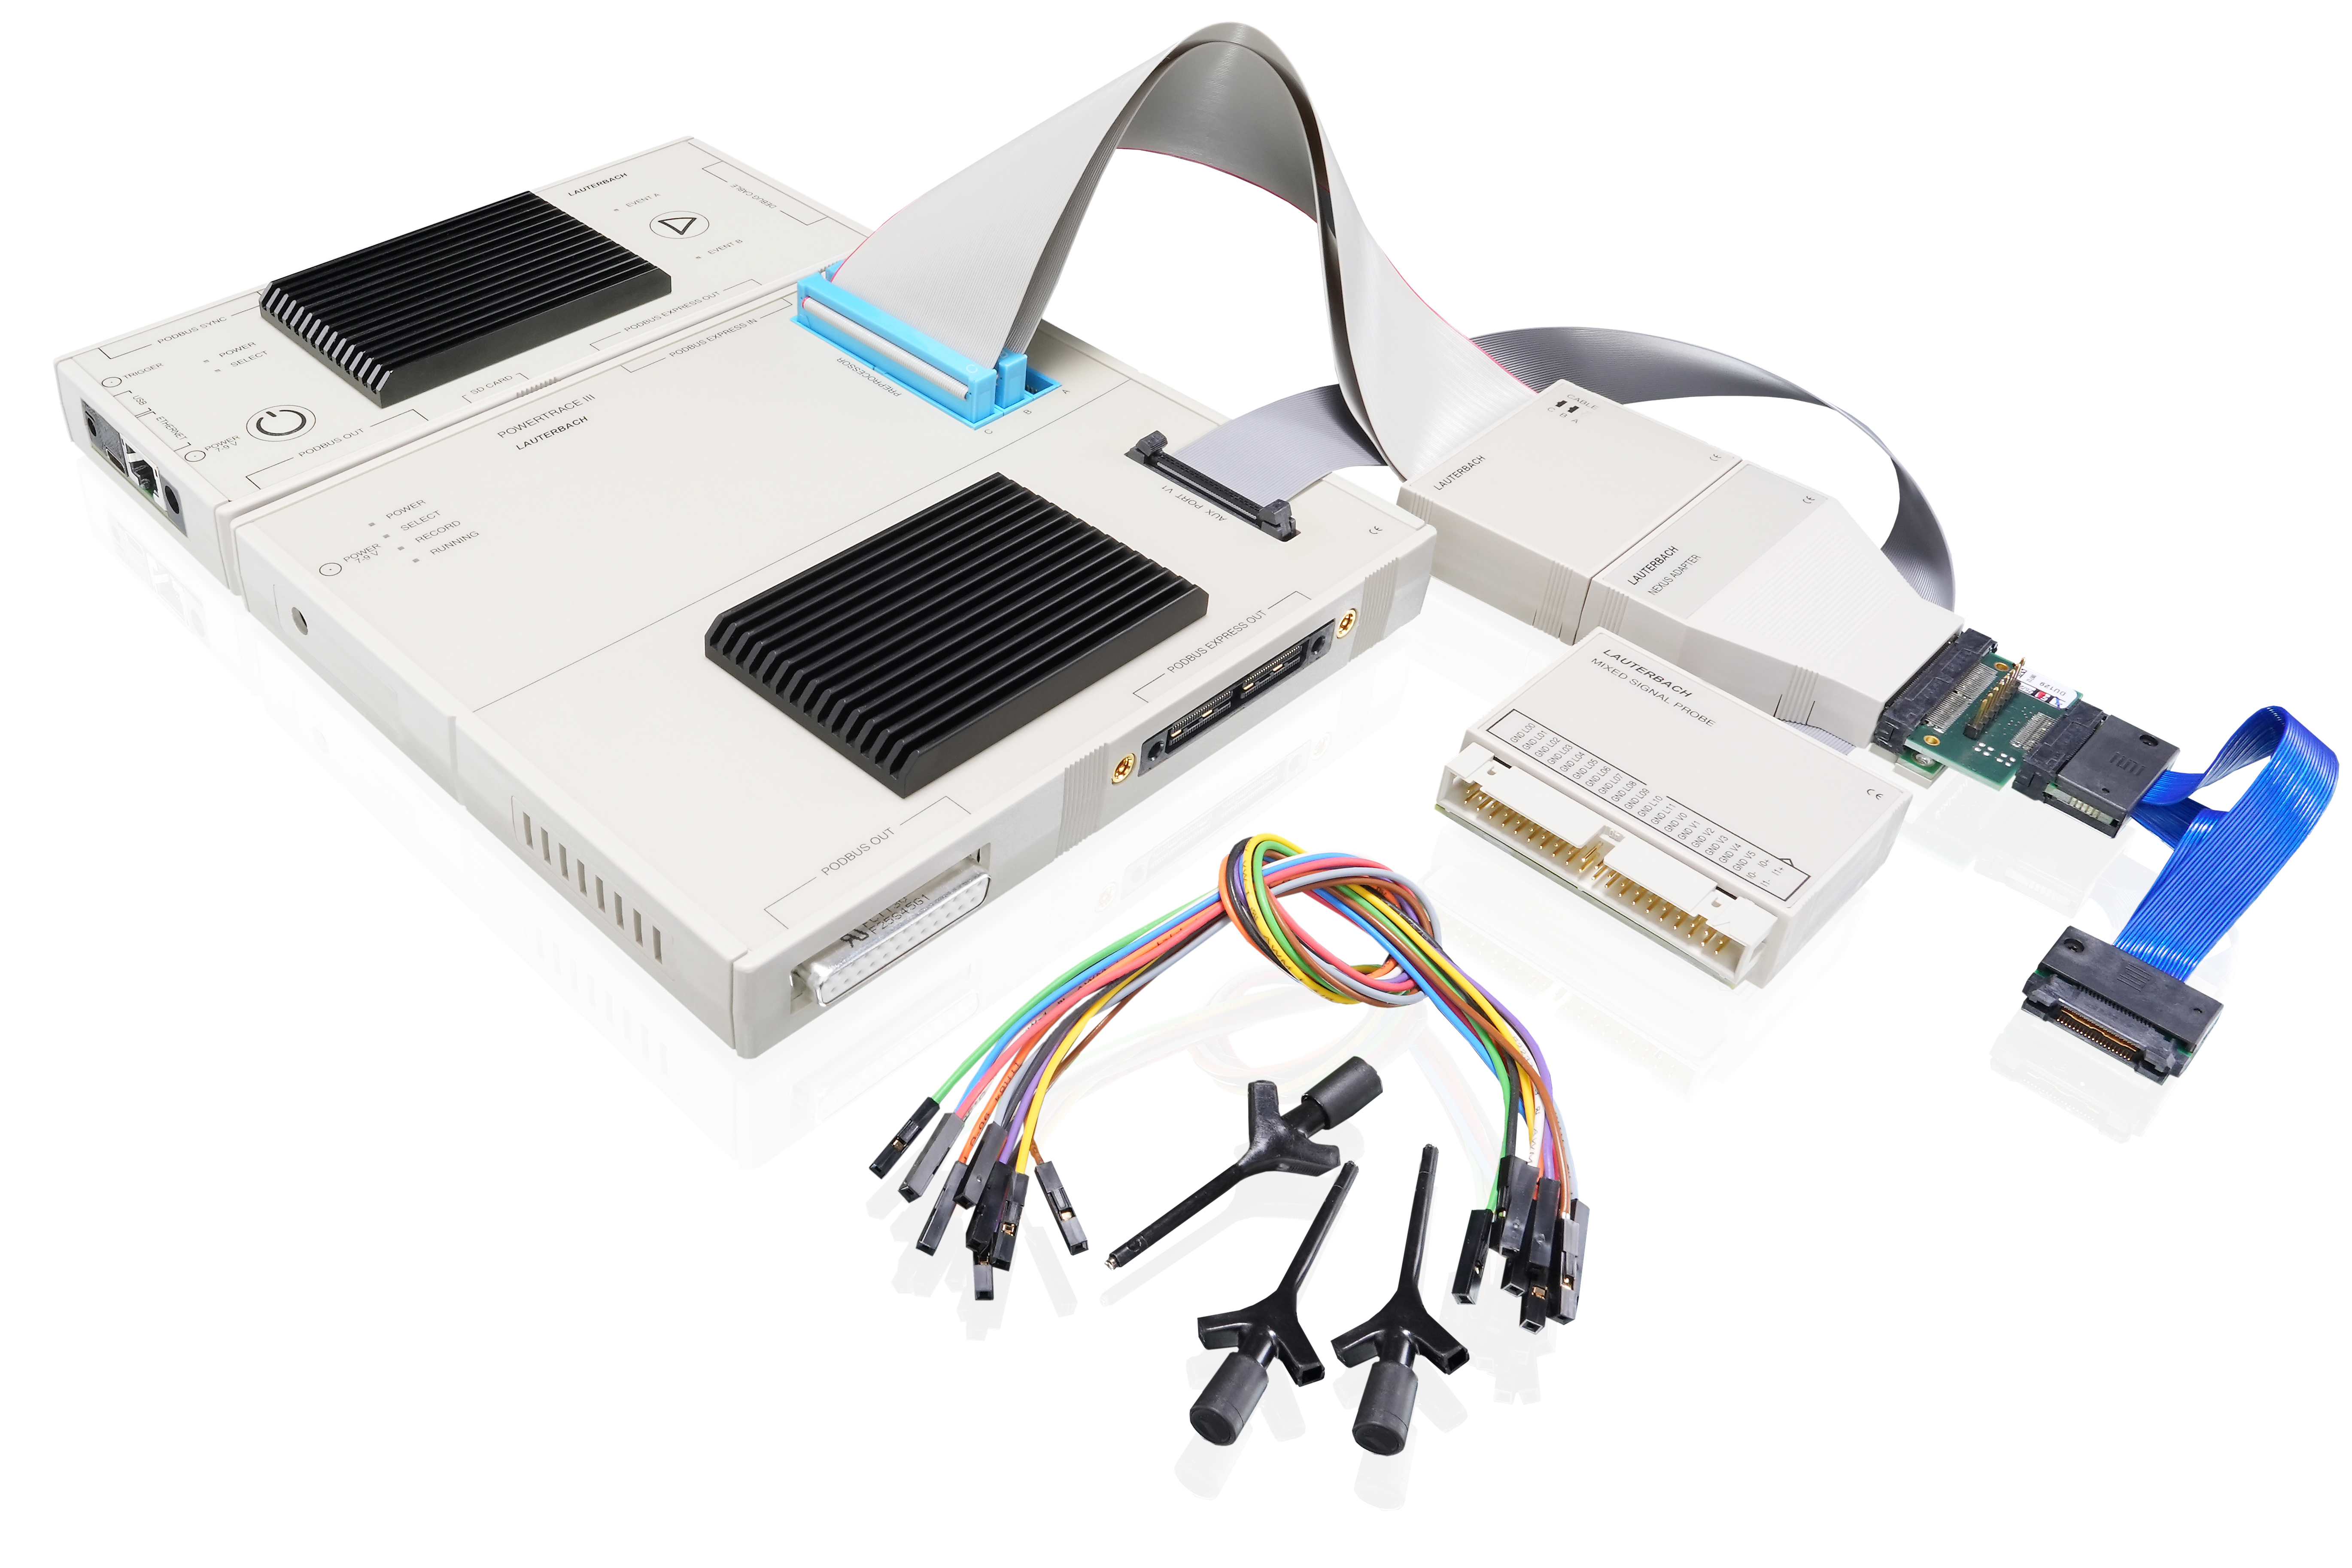
PowerPC Parallel Trace
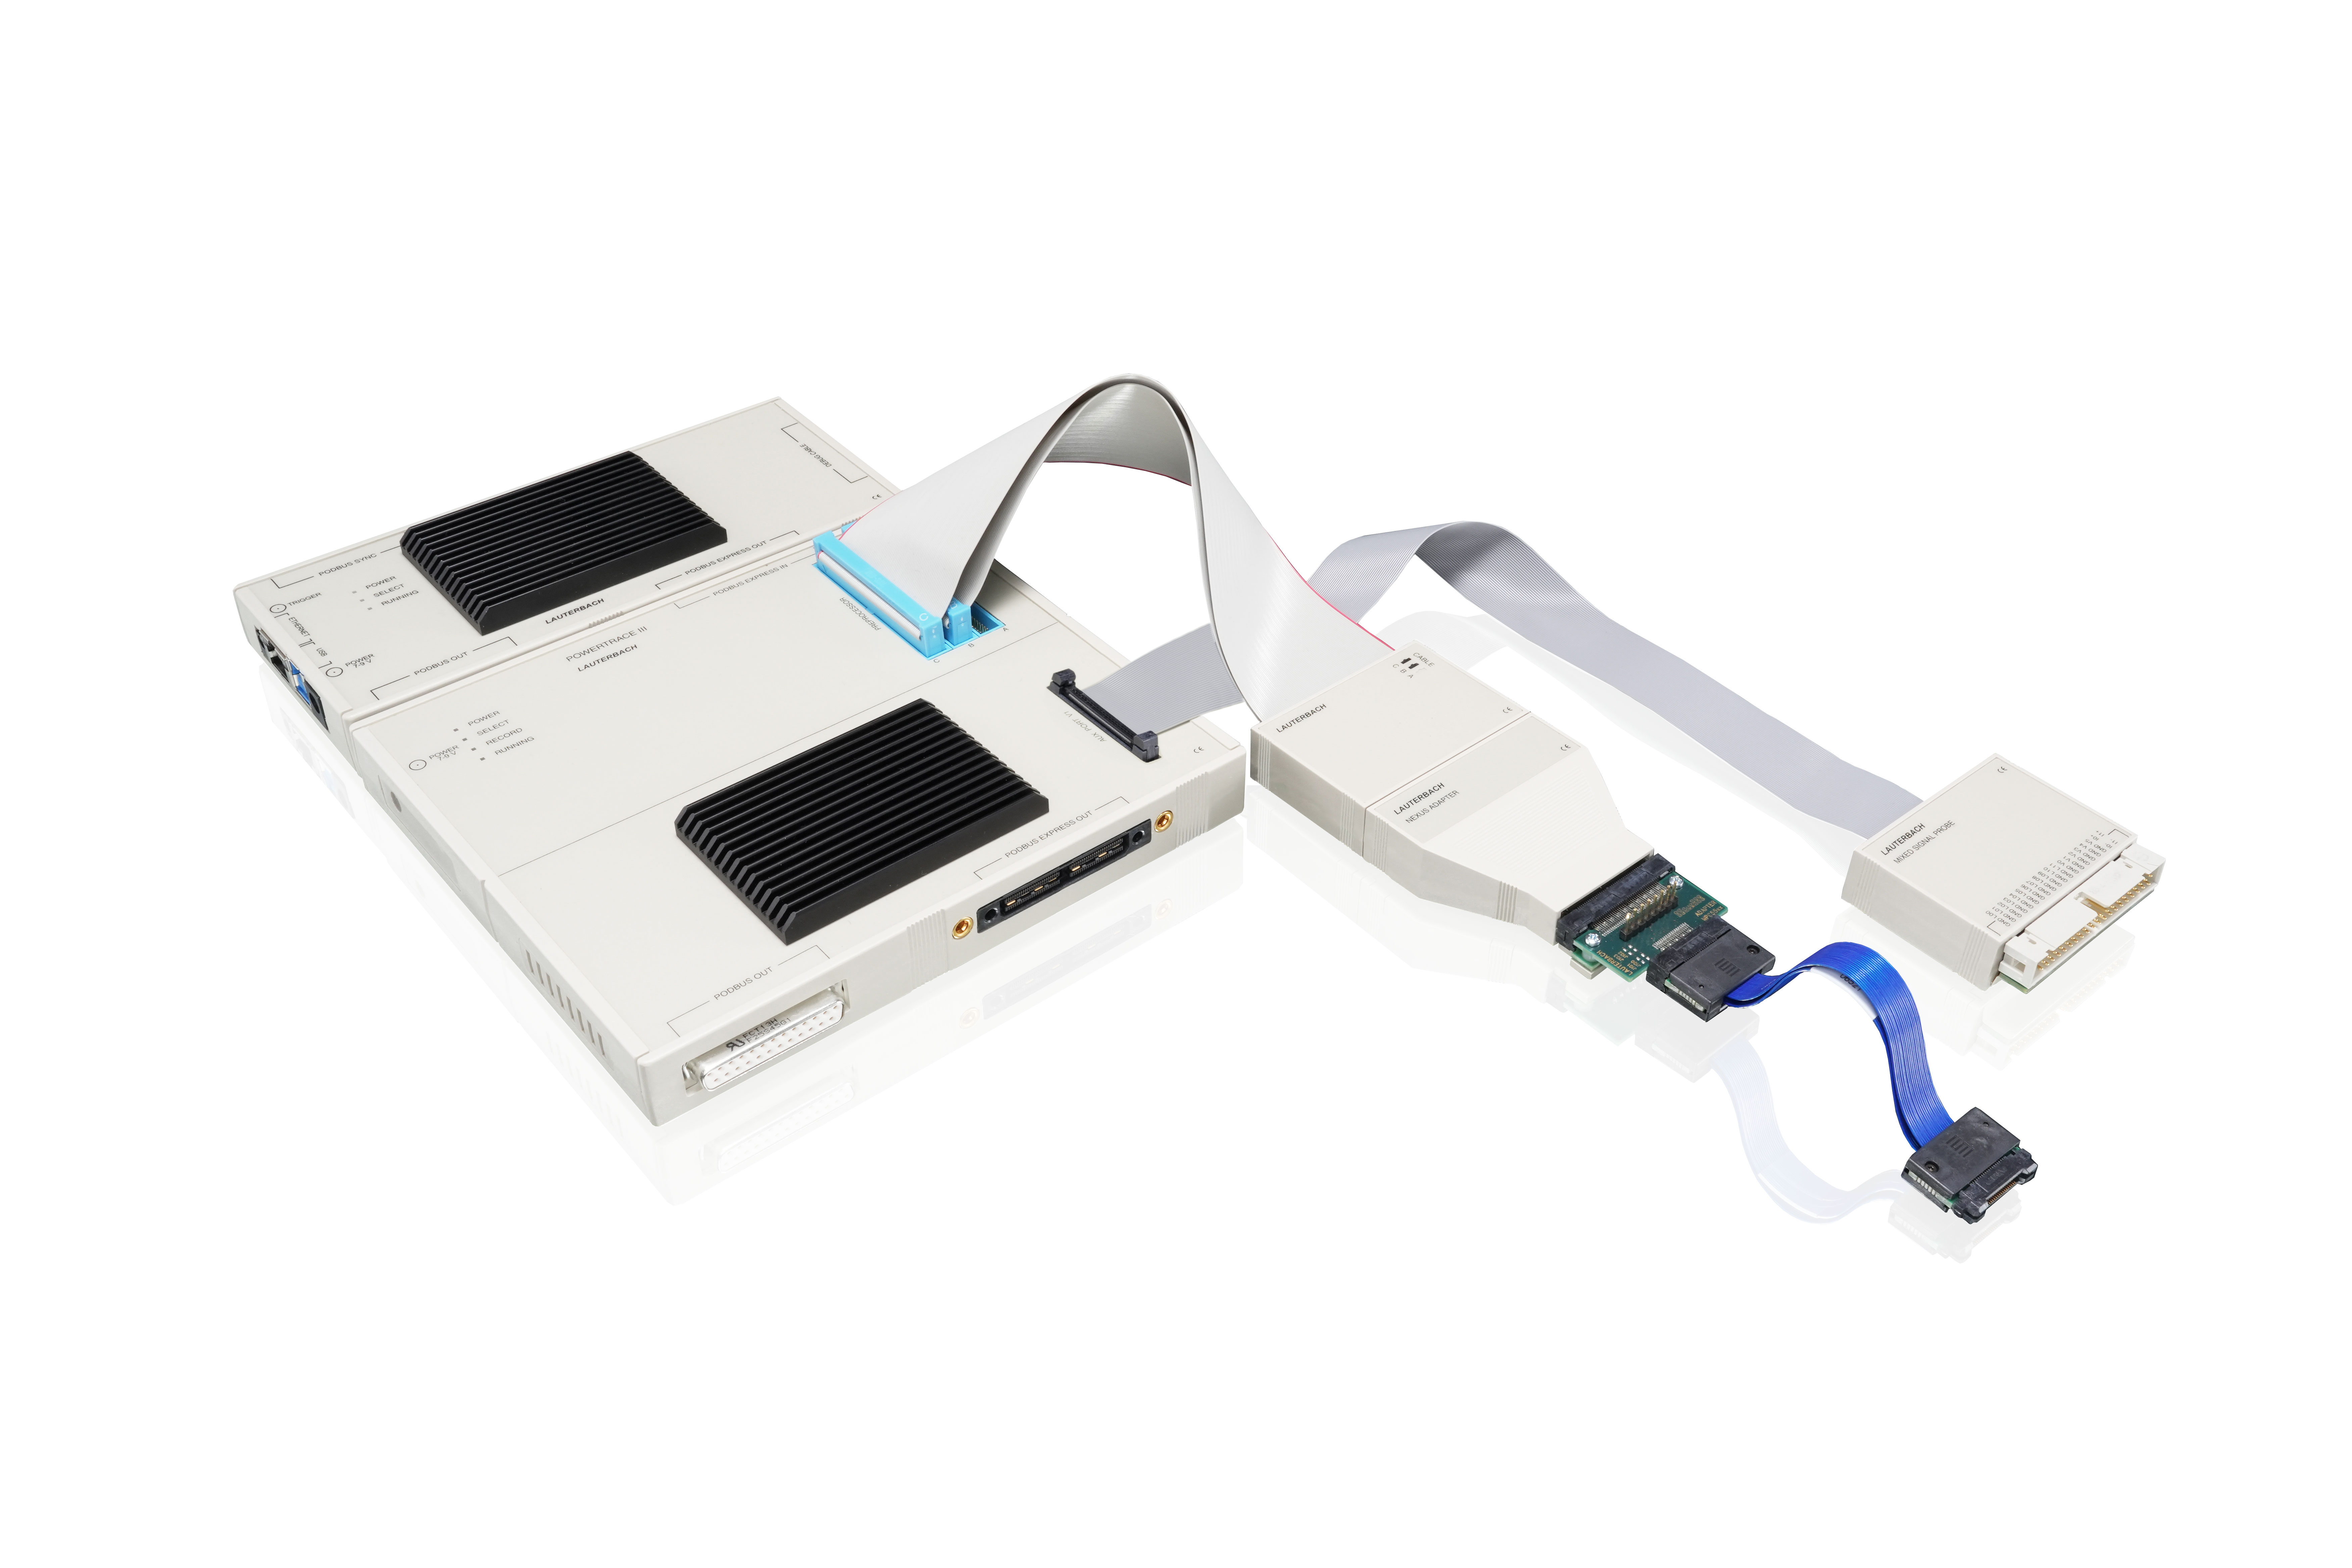
Analyze the program flow with data accesses from SoCs of the MPC5xxx and SPC5xx microprocess families by connecting to a parallel NEXUS auxiliary trace port. Attaching a Mixed-Signal Probe allows additional energy profiling or protocol analysis, e.g. of an attached CAN bus.
Products included:
- PowerDebug X51
- PowerTrace III
- Nexus Adapter for MPC5xxx
- Mixed-Signal Probe


