Xtensa Debugger & Trace
The Perfect Solution for Debugging Xtensa Cores Across Diverse SoC Designs
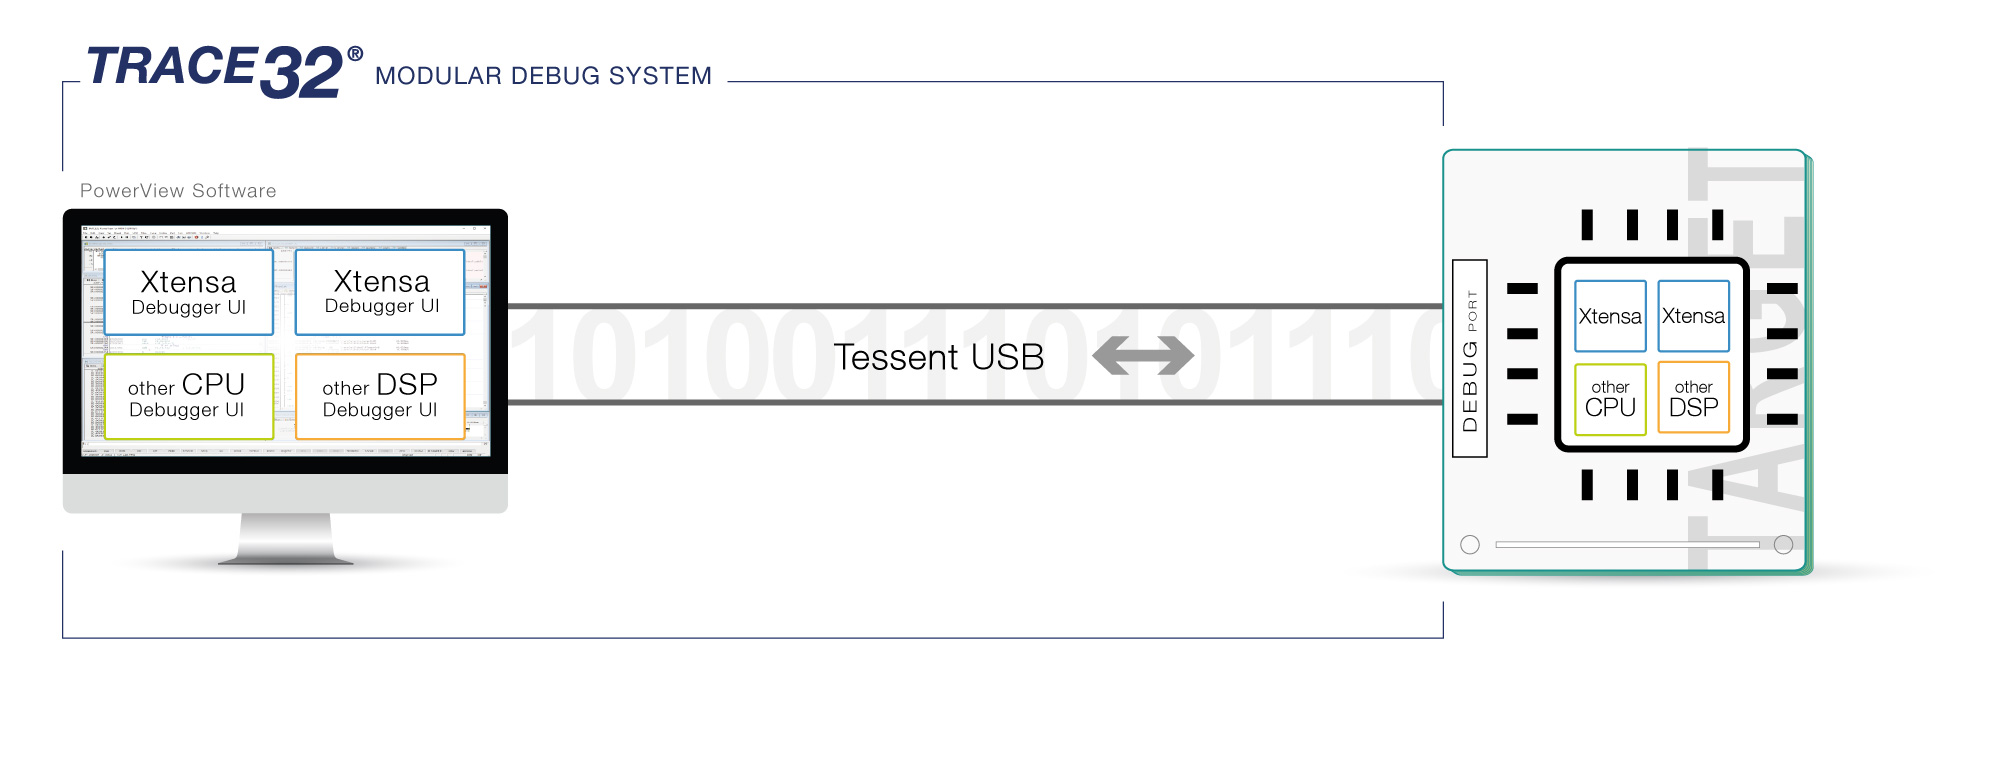
Xtensa is a configurable processor IP from Cadence which System Designers can optimize for their embedded application by sizing and selecting features and adding new instructions. Using our world-leading TRACE32® tools you can simultaneously debug and control a wide variety of Xtensa cores (along with all of the other cores) in an SoC via a single debug interface. TRACE32® supports all levels of application; form small embedded controllers up to large multi-core compute-intensive data-processing engines.
Supported Sub-Architectures
Xtensa® LX4/LX5/LX6/LX7/LX8, Xtensa® NX
Utilizing All Debug Features
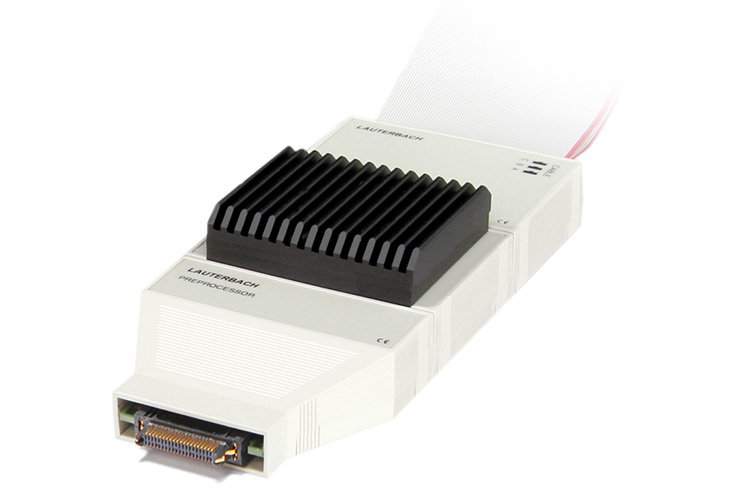
Explore and utilize all the powerful and well-known features of your Xtensa core with Lauterbach debug modules: full on-chip breakpoint support; flash programming; benchmark counters; and cache view. And of course, everything is scriptable, enabling you to repeat the same test-sequence over and over.
Learn more about our debug system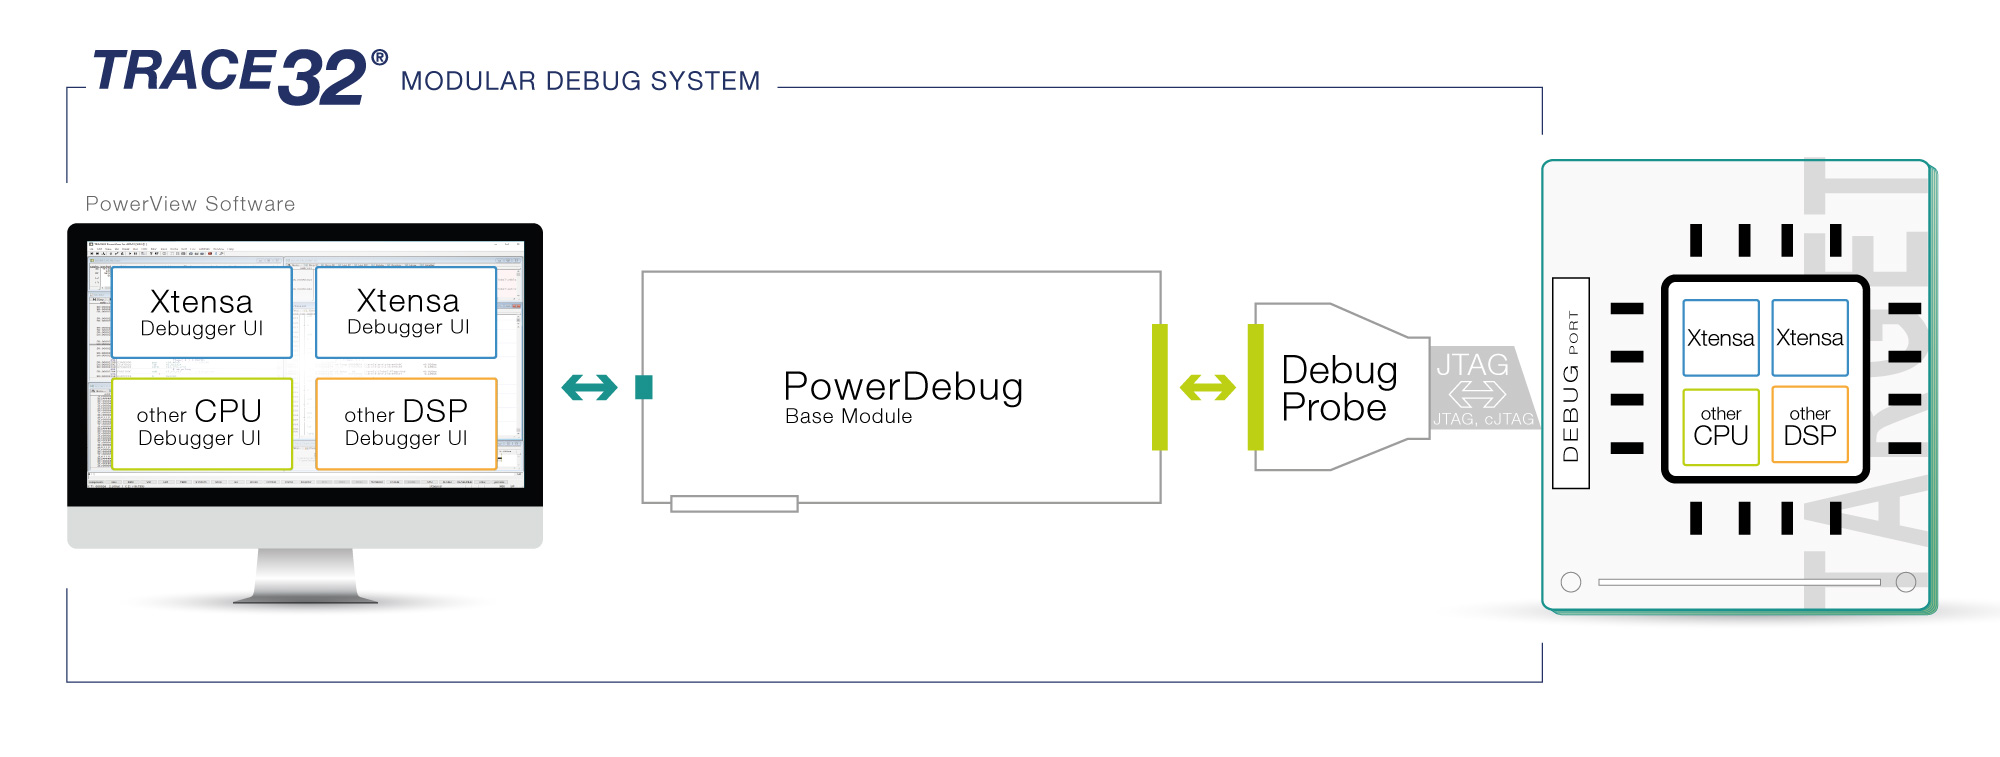
Which Xtensa core do you want to use?
Check out our catalogue of predefined solutions and find the ideal toolset for your project.
Capture Your Core’s Actions
Stop mode debugging can be a powerful tool but tracing is even better. Our Xtensa trace solutions support both the NEXUS-5001 compatible TRace Analyzer for Xtensa (TRAX) and off-chip tracing. TRAX is license free and stores the generated trace information to a user-configurable on-chip memory buffer. The off-chip trace solution provides significantly greater data gathering capabilities (up to 8GBytes) and support the embedding of TRAX packets in an Arm CoreSight trace stream. Used in the manner, trace correlation between cores can be performed.
*Timestamps have to be configured within the Xtensa core.
Which Xtensa core do you want to use?
Check out our catalogue of predefined solutions and find the ideal toolset for your project.
Get Ready Before Your Silicon is
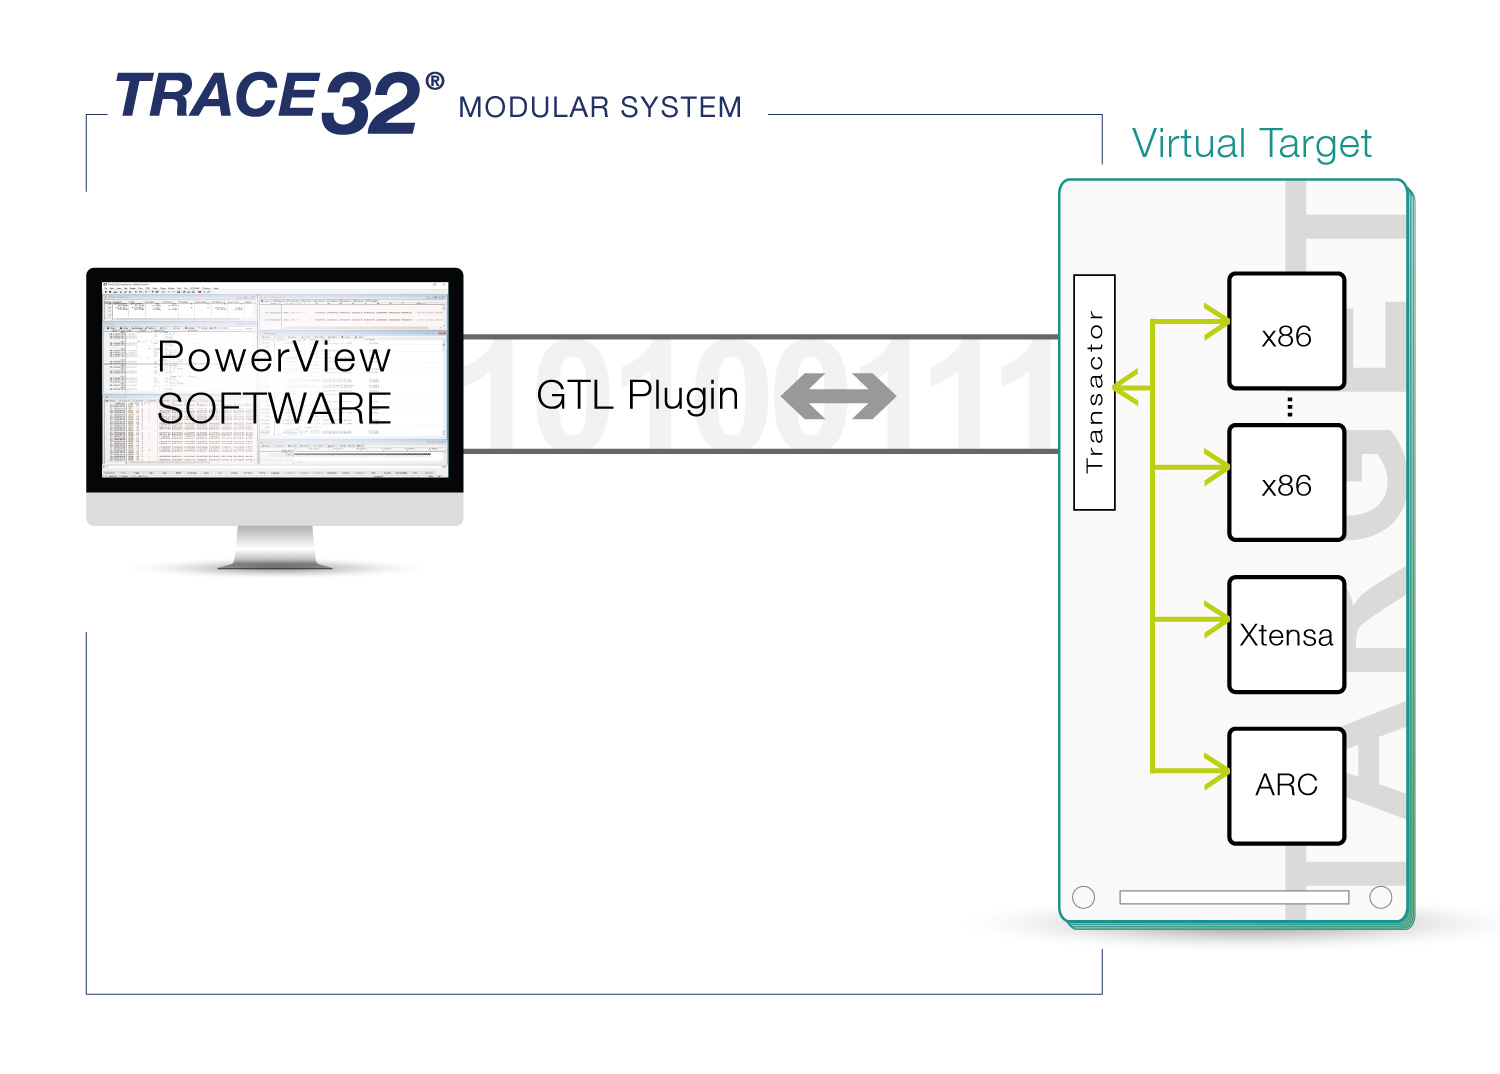
Test your Xtensa code in your custom SoC before your SoC is ready. Taping out your SoC takes a lot of time but TRACE32 allows you to start software development on virtual prototypes and simulators, using the same GUI and toolset that you would use later with the real chip.
Verify your SoC, including debug mechanisms, before taping out, using simulated Verilog or VHDL netlists. The Lauterbach Generic Transactor Library (GTL) allows you to perform pre-silicon debugging at register level.
3rd Party Tools Supported for Xtensa
The following features are available for all architectures supported by TRACE32. Please contact us if your device or tool is not listed here; support is often already on its way.


