PowerPC Debugger & Trace
Your Reliable PowerPC Debugger for All Industries
Processors based on the PowerPC architecture are a major player in many industries: Automotive, aerospace, avionics, networking, infotainment, and automation – to name just a few.
A debugger that has to serve in so many industries needs to be powerful and reliable, and we have been partnering with all manufacturers of PowerPC processors to provide the best debug experience possible. Our customers in some of those industries need more than just a debugger. They need a tool that analyzes the hardware and software performance in depth, a tool that allows investigation of any issue in highest detail, a tool that assists in verifying safety-critical applications, or a tool that assists when a processor is undergoing radiation tests. Our trace tools enable non-intrusive run-time measurements and functional safety verification for standards such as ISO26262 and DO330 without code instrumentation.
Thanks to our close relationship with all manufacturers of PowerPC processors, we are able to provide PowerPC debuggers for all variants of the PowerPC family. Our active participation in many international standards groups, such as MIPI, Power.ORG, and NEXUS5001 made it possible for us to provide first class tools for pre- and post-silicon development, validation, and testing.
We deliver debug features of the highest quality through our PowerView GUI.
Supported Sub-Architectures
MPC5xxx, SPC5, PPC4xx, MPC5xx, MPC603/750, MPC74xx, MPC86xx, QorIQ, PowerQuicc
State-Of-The-Art Debugger for State-Of-The-Art Projects
Uncover the PowerPC processor internals down to the finest details with Lauterbach PowerDebug Systems: Full on-chip and software breakpoint support, run-time memory access, flash programming, benchmark counters, cache and MMU views. Everything is scriptable, enabling you to perform automated tests.
Which Power PC core do you want to use?
Check out our catalogue of predefined solutions and find the ideal toolset for your project.
Capture Your Core’s Actions
Stop mode debugging can be a powerful tool, but tracing is even better. Our trace solutions for PowerPC support Nexus on- and off-chip traces, as well as other proprietary trace protocols. On some processors without hardware trace support, TRACE32® tools offer software trace solutions based on code instrumentation.
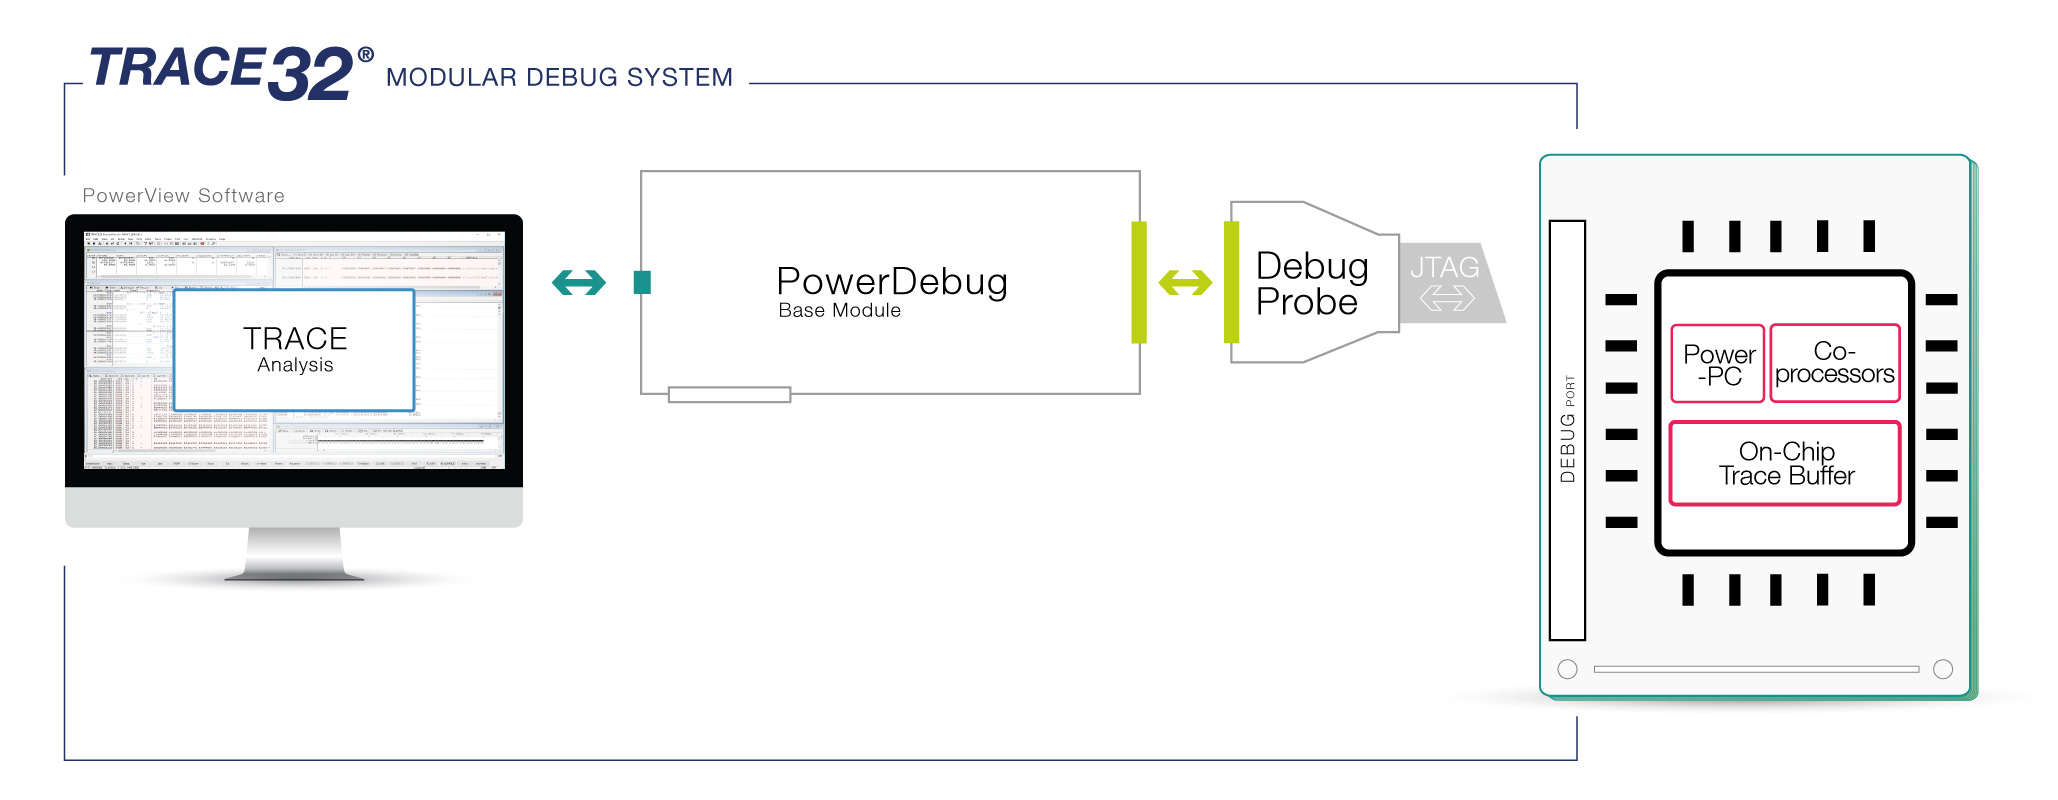
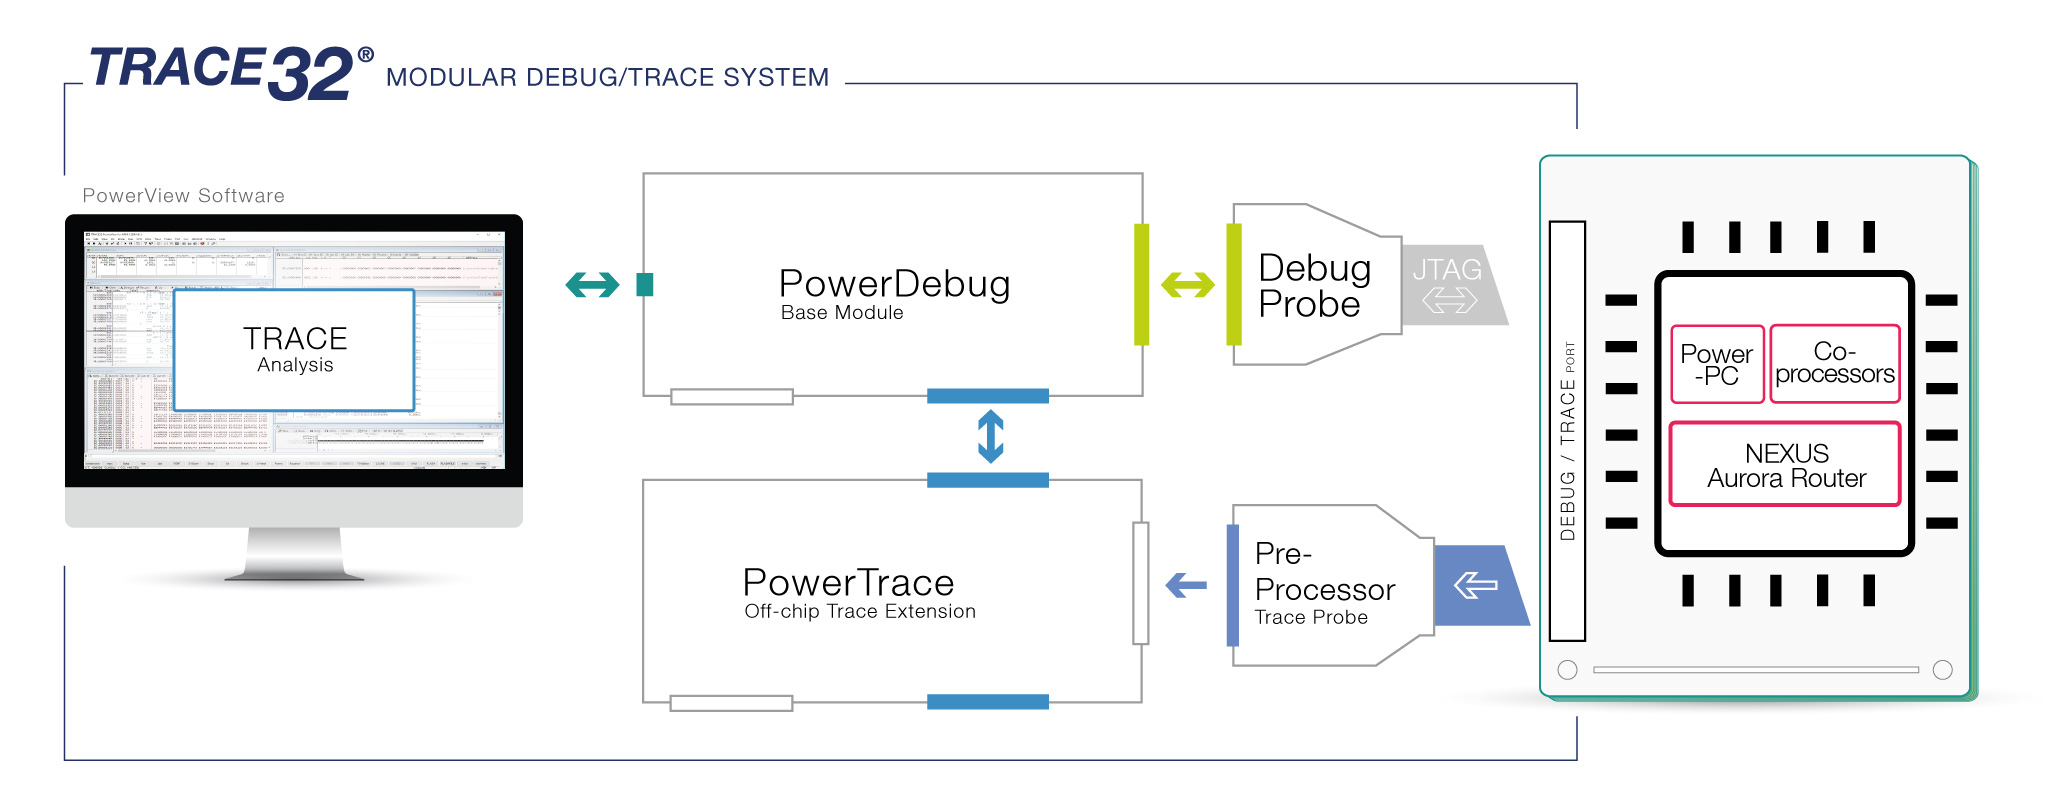
Powerful Off-Chip Nexus Trace
A trace extension empowers you to obtain the program flow and data from cores, as well as data trace from other bus masters with Nexus module, such as DMA or FlexRay. TRACE32®️ also supports tracing through processor reset and target power cycles. TRACE32®️ Nexus trace tools are the ideal solution for code-coverage and long-term run-time measurements.
Nexus Trace-To-Memory
Processors with the Nexus trace-to-memory feature have a small on-chip trace buffer that stores the Nexus trace messages on the chip. This on-chip trace buffer is convenient for quickly tracking down issues. Some processors can even route the trace information to the target’s SDRAM or to an existing PCI channel, enabling deep trace without a dedicated port.
Perfect for Safety Critical Applications
TRACE32®️ trace tools enable you to perform functional safety verification for standards such as ISO 26262 and DO-178C with our Tool Qualification Support Kit.
All PowerPC Trace Protocols
TRACE32®️ tools offer support for all PowerPC trace protocols: Nexus (parallel), Aurora Nexus, PPC4xx trace, PCFIFO, or the MPC85XX peripheral address trace.
The Solution for the Whole Development Cycle
When using Lauterbach’s TRACE32® tools, there is a whole world of possibilities open to you, which goes far beyond the traditional JTAG/BDM debugger and covers the whole product development cycle, from pre-silicon SoC design verification and application development, unit testing with and without target hardware, to closed-chassis debugging and analysis of customer returns. Perform all these tasks with our common TRACE32® PowerView user interface, which allows effortless switching between development cycles.
Standardized APIs for 3rd-party Simulations
Use our powerful user interface with the simulation of your choice, connected via standardized APIs like MCD or GDB. Or, connect to a gate-level netlist Emulation via our GTL API to verify SoC designs, or to boost early application development.
Unit Testing with Integrated Instruction Set Simulator
TRACE32® PowerView provides a built-in instruction set simulator, which is perfect for module and regression tests. You can extend the simulator via a dedicated API with your own peripheral models of your hardware.
Process-level Debugging
If your target OS provides a process-level debugger (e.g. gdbserver on Linux), you can use the PowerView GUI as a front-end to that debug server.
In-Field Debugging
If your ECU is equipped with an XCP compliant device, e.g. a calibration tool, it is possible to debug the ECU with PowerView through the XCP, even when the ECU is in its chassis and buried deeply in the vehicle.
3rd Party Tools Supported for PowerPC
The following features are available for all architectures supported by TRACE32. Please contact us if your device or tool is not listed here; support is often already on its way.


