RISC-V® Debuggger & Trace

OVERVIEW

Any RISC-V Core in Any Chip

Analyze any design implementing the RISC-V Instruction Set Architecture (ISA), from a single tiny microcontroller using an RV32, to a massive multicore application processor, that uses the RV64 with our leading edge development tools.

Using our TRACE32® tools you can debug and control any RISC-V core (along with all of the other cores) in any SoC via a single debug interface, all at the same time. TRACE32® tools support real-time on- and off-chip tracing for all major RISC-V trace systems.

From the beginning we have been a strategic member of the RISC-V foundation, supporting nearly all today’s chips implementing the RISC-V ISA. Thanks to the long-standing close partnership with RISC-V processor designers and semiconductor manufacturers, future chip developments enabled by us from the very beginning – ensuring your future-proof investment.

Supported Sub-Architectures

RISC-V 32bit/64bit, AndesCore™ V5, SiFive® Core IP

DEBUG HIGHLIGHTS

Utilize All Debug Features for All RISC-V ISA Extensions

By using our powerful debug modules you can apply our full debug feature set to any RISC-V core design including all ISA extensions like floating point, compressed instructions, vector arithmetic, atomic instructions, integer multiplication and even custom ISA extensions. Utilize full on-chip breakpoint support, run-time memory access, flash programming and benchmark counters. Everything is scriptable, which enables you to automate tests very easily.

Learn more about our debug system 
  • JTAG+RISC-V
  • JTAG+Arm
  • JTAG+Tessent

Support of Any Debug Interface Protocol

Debug via classic JTAG, compact JTAG (2-wire), Arm CoreSight SoC-400/600 (SWD, APB, JTAG-AP, CTI) and Tessent debug interfaces (JTAG/USB communicator, JPAM, cross-triggering).

Support for All RISC-V ISA Extensions

Use our Disassembler and assembler to debug the code of any RISC-V core design including all ratified ISA extensions. To support custom RISC-V ISA extensions, we can extend our disassembler, assembler and all other affected components in our toolchain.

Debug RISC-V Cores in Multi-Architecture SoCs

Debug all your RISC-V cores and non-RISC-V cores at the same time with just one debug probe. We support RV32 (32 bit) as well as RV64 (64 bit) RISC-V cores, and a mix of both, in symmetric (SMP) or asymmetric (AMP) multiprocessing environments.

Debug the Full Software Stack

Work with many popular target operating systems like FreeRTOS™, Linux™, Zephyr OS™ and others. TRACE32® OS-aware debugging can query and display all OS objects such as threads, message queues, and more.

TRACE FEATURES

Capture Your Core Actions on Each RISC-V Chip

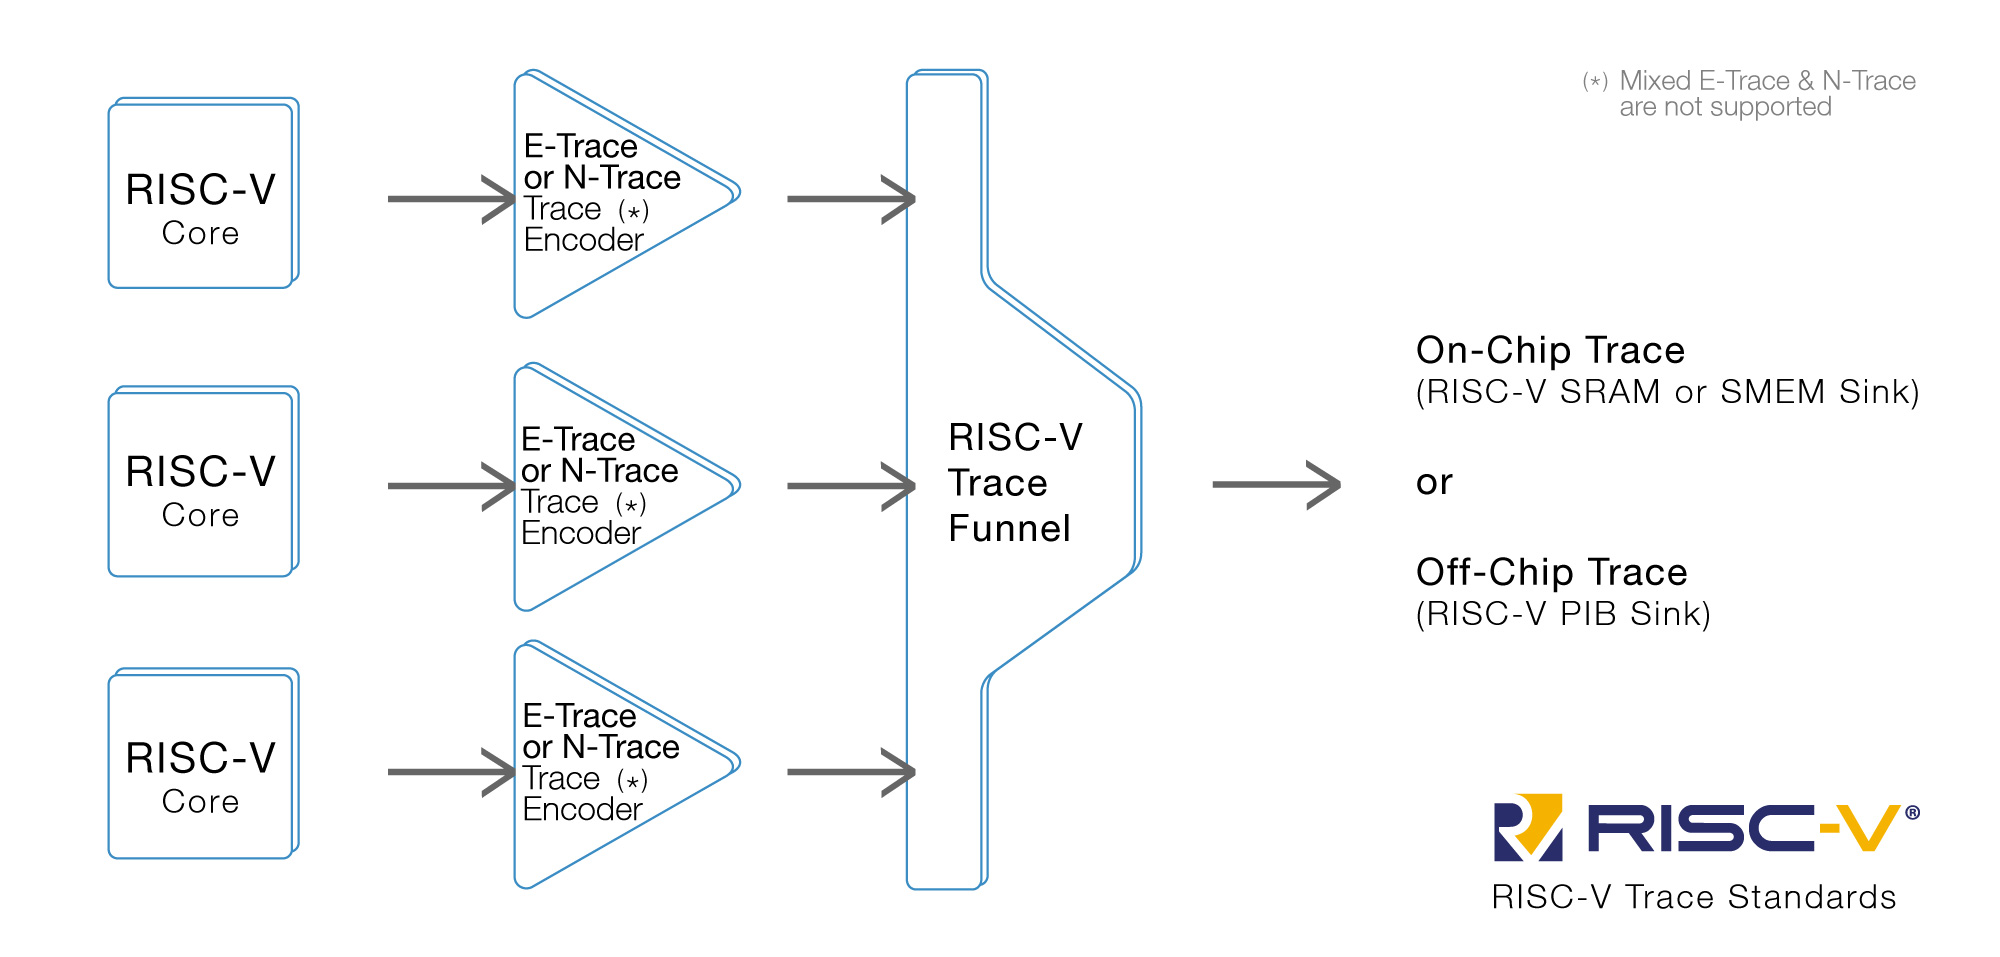
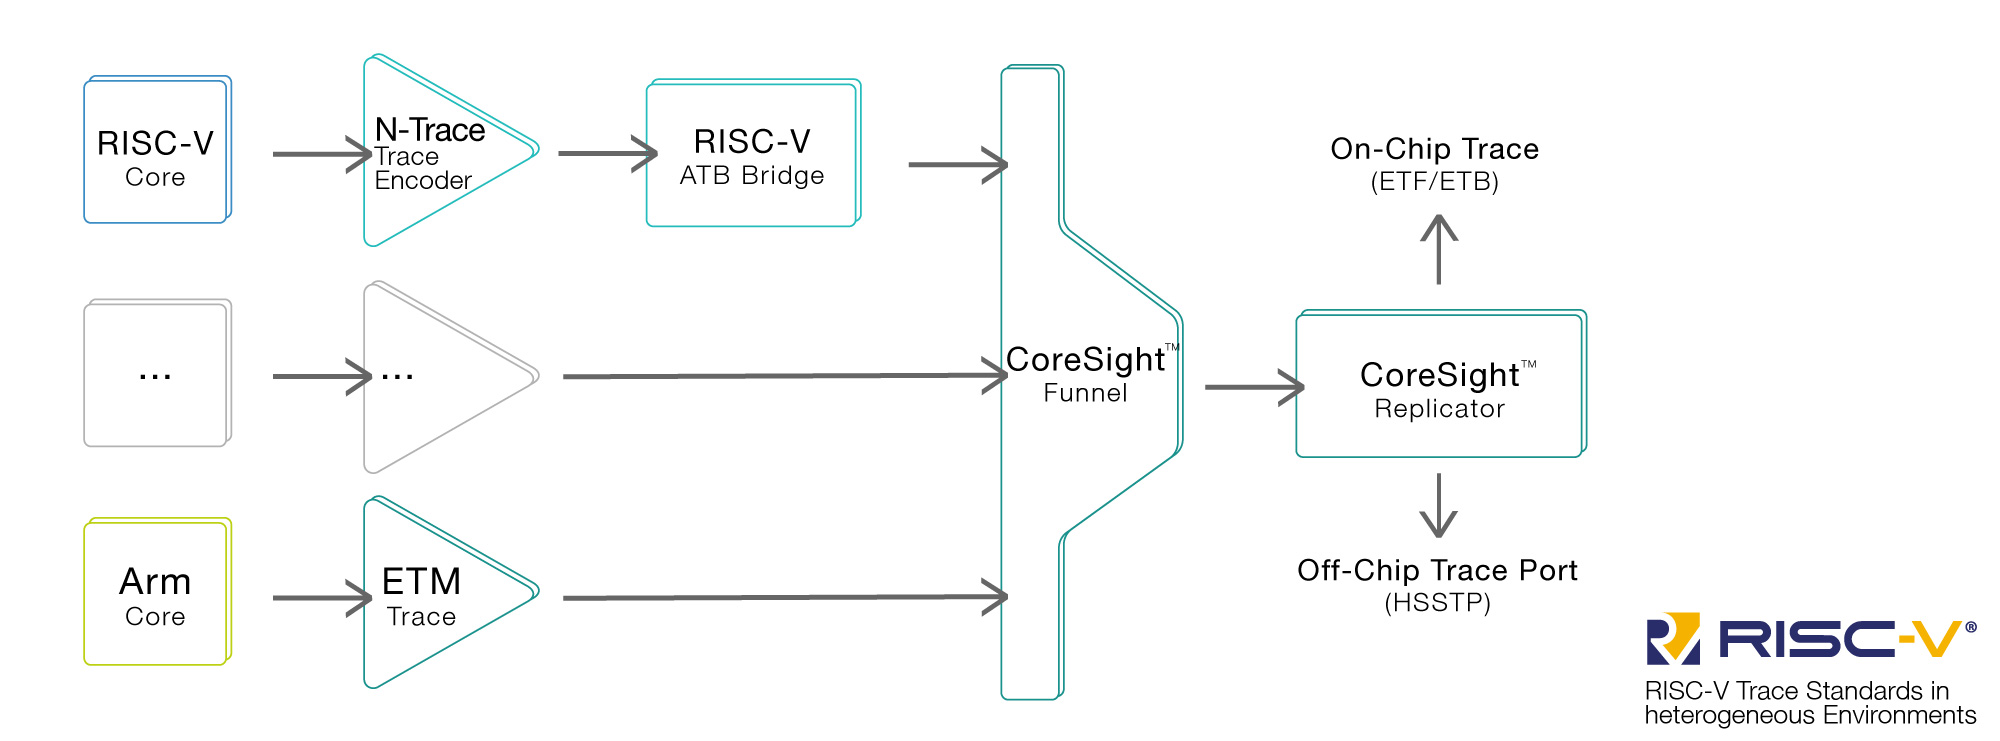
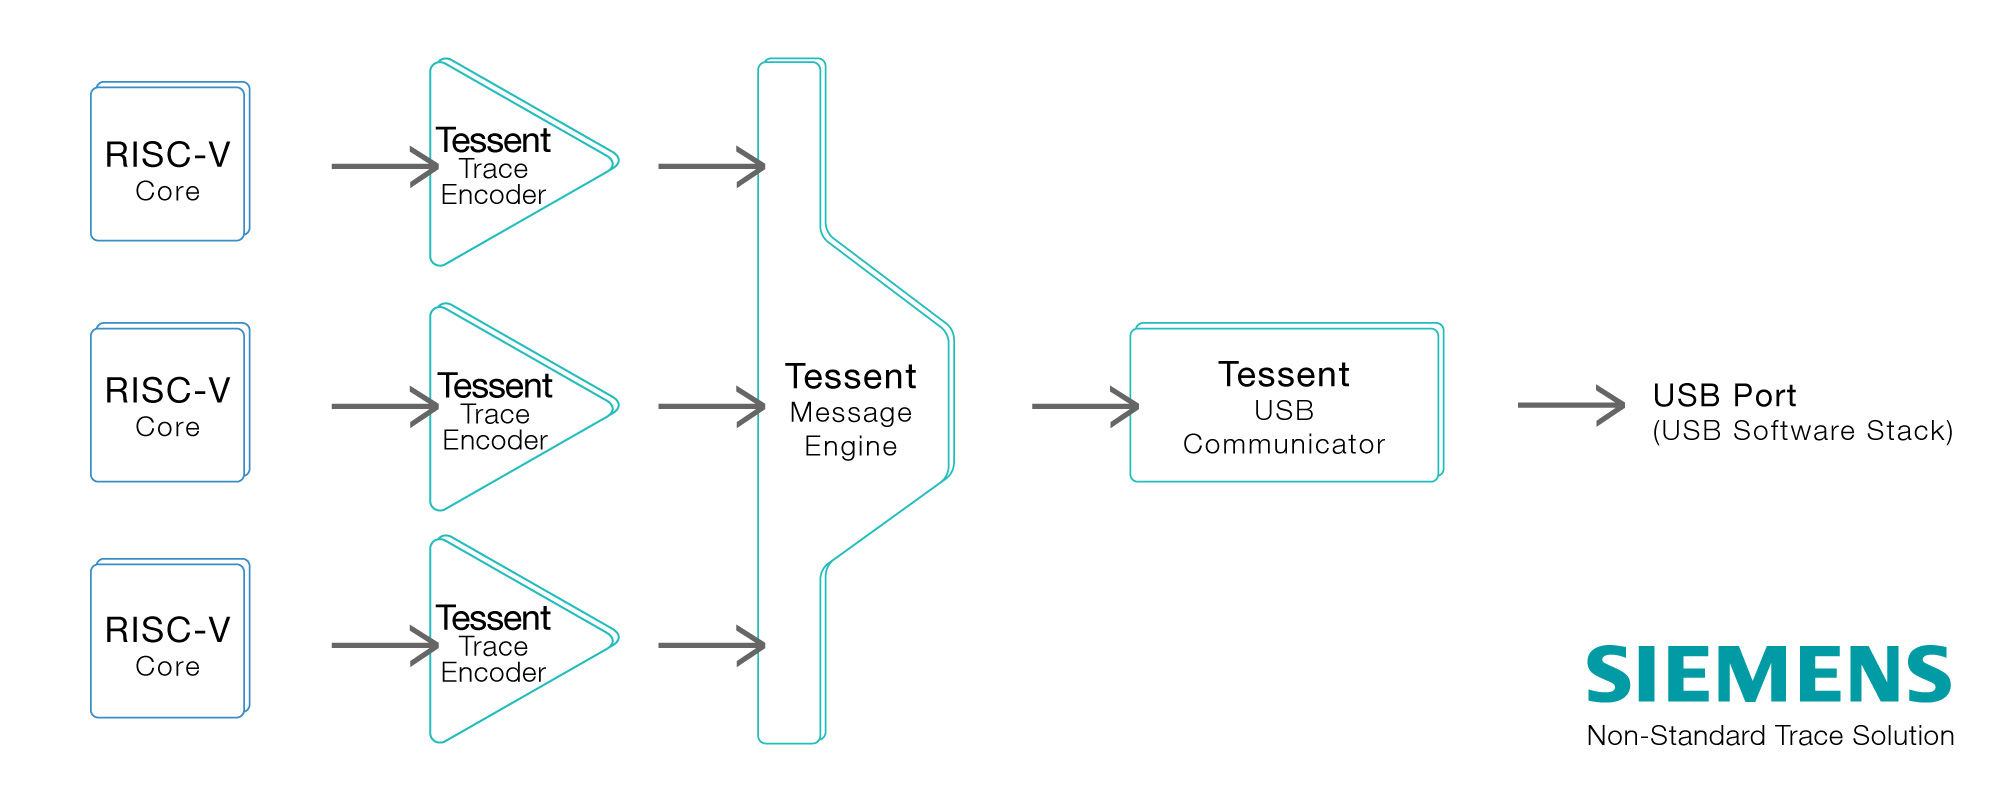
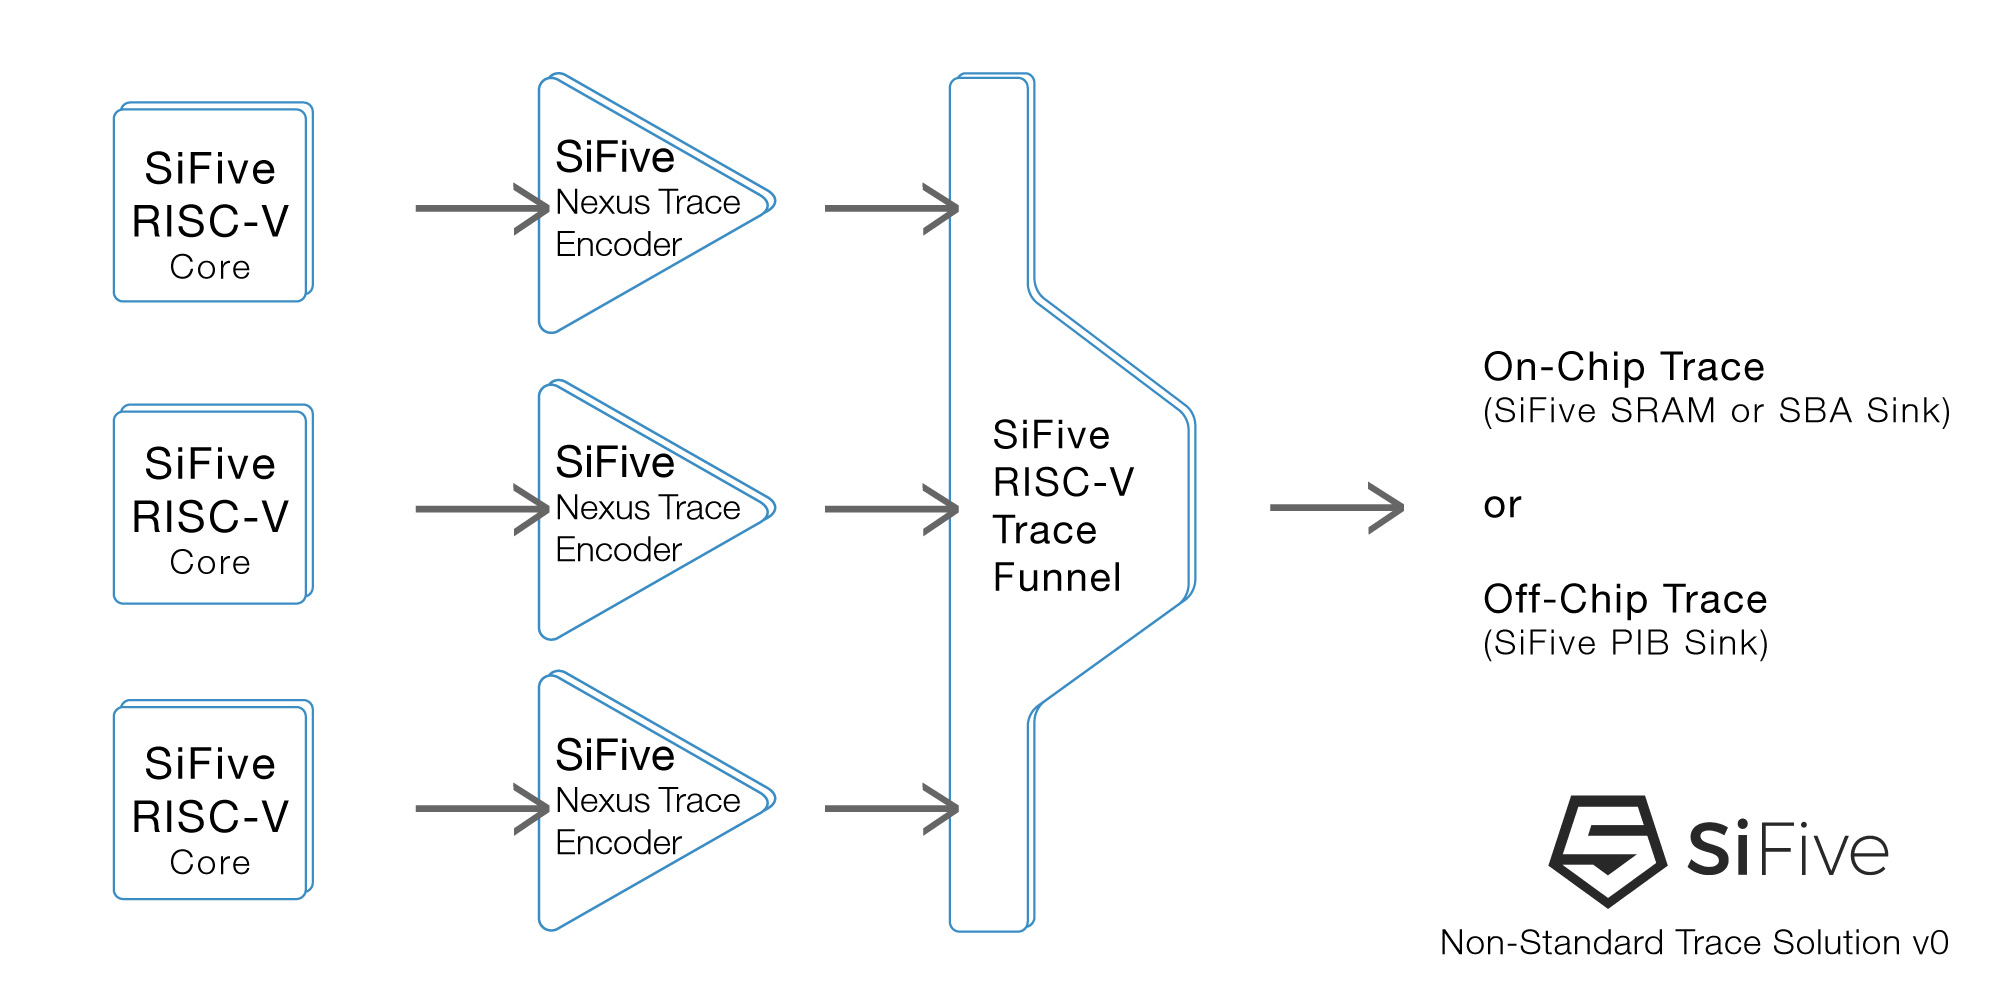
Stop mode debugging can be a powerful tool but tracing is even better. Our trace solutions for RISC-V support both on-chip trace for various technologies as well as the much more powerful off-chip trace, which can save the trace data inside the target memory or emit it to one of our PowerTrace tools.

Learn more about our trace system  

  • Tests_Core-Sight-SiFive-Arm
  • Tests_Tessent-Coresight
  • Tests_Tessent-Siemens
  • Tests_RISC-V_3

Support of Both Important RISC-V Trace Sources

Our TRACE32 tools support both the proprietary SiFive Nexus Trace Encoder and the proprietary Tessent Trace Encoder. In both cases, the trace IP is also supported when it is integrated into an Arm CoreSight trace infrastructure.

Wide Support of RISC-V Off- and On-Chip-Trace

Our TRACE32 tools support all major parallel and serial off-chip-trace interfaces which are implemented in RISC-V chips. They include RISC-V PIB, Arm TPIU, AURORA and Tessent USB. Furthermore TRACE32 supports many on-chip-trace technologies, which are implemented in RISC-V chips, as well. These include Arm CoreSight (ETF, ETB, ETR), Tessent SMB and SiFive SRAM/SBA.

Analyse Interactions Between Multiples Cores

Our trace solutions support multicore tracing to record and analyze the dynamic interaction be-tween cores. For mixed-architectures SoCs, we support protocols like CoreSight Trace Formatter, to concurrently trace RISC-V and non-RISC-V cores.

Obtain Detailed Runtime Information

Our trace solutions can record the complete program flow, provided by the SoCs Trace IP. Based on the data recorded, our tools provide you with detailed timing and code-coverage measurements. This works best with the deep memory of our PowerTrace modules.

VIRTUAL PROTOTYPING

Get Ready Before Your Silicon is

Test your RISC-V code in your custom SoC before your SoC is ready. Taping out your SoC takes a lot of time, but TRACE32 allows you to start software development on virtual prototypes and simulators, using the same GUI and toolset that you would use later with the real chip. To some extent it is also possible to verify the debug interface of your individual SoC before starting the taping out.

Integrate GDB and Debug Code in SystemC Models

Integrate the GNU Debugger, GDB, with fast cycle accurate SystemC models of processors and systems-on-chip (SoC) for early software development, testing and performance analysis before silicon is available.

Debug Multiple RISC-V Cores on Virtual Platforms

Connect TRACE32® PowerView via the multi-core debug (MCD) API for debugging code in full-processor models. Use any virtual prototyping platform supporting MCD, for example Synopsys Virtualizer.

Unit Testing with Integrated Instruction Set Simulator

TRACE32® PowerView provides a built-in RISC-V instruction set simulator, which is perfect for module and regression tests.

Perform Pre-Silicon Verification

Verify your SoC, including debug mechanisms, before taping out, using simulated Verilog or VHDL netlists. The Lauterbach Generic Transactor Library (GTL) allows you to perform pre-silicon debugging on JTAG level.

TOOLCHAIN SUPPORT

3rd Party Tools Supported for RISC-V

Compiler (1)
Product
Company
Language
GCC
C, C++, GCC
Simulators, Emulators and Virtual Targets (4)
Product
Company
GDB
HIPERSIM
Tessent Embedded Analytics - former UltraSoc
VIRTUALIZER and VDK

The following features are available for all architectures supported by TRACE32. Please contact us if your device or tool is not listed here; support is often already on its way.

Host OS

Our debug software runs on all major operating systems.

Flash Devices

We support the programming of a large variety of flash devices. NOR, NAND, SPI, QSPI, EMMC and more.

3rd Party Integrations

Integrations allow you to easily use TRACE32 with other tools.

RELATED PRODUCTS

TRACE32 Related Products for RISC-V