RH850 Debugger & Trace
Any RH850 Core in Any Chip
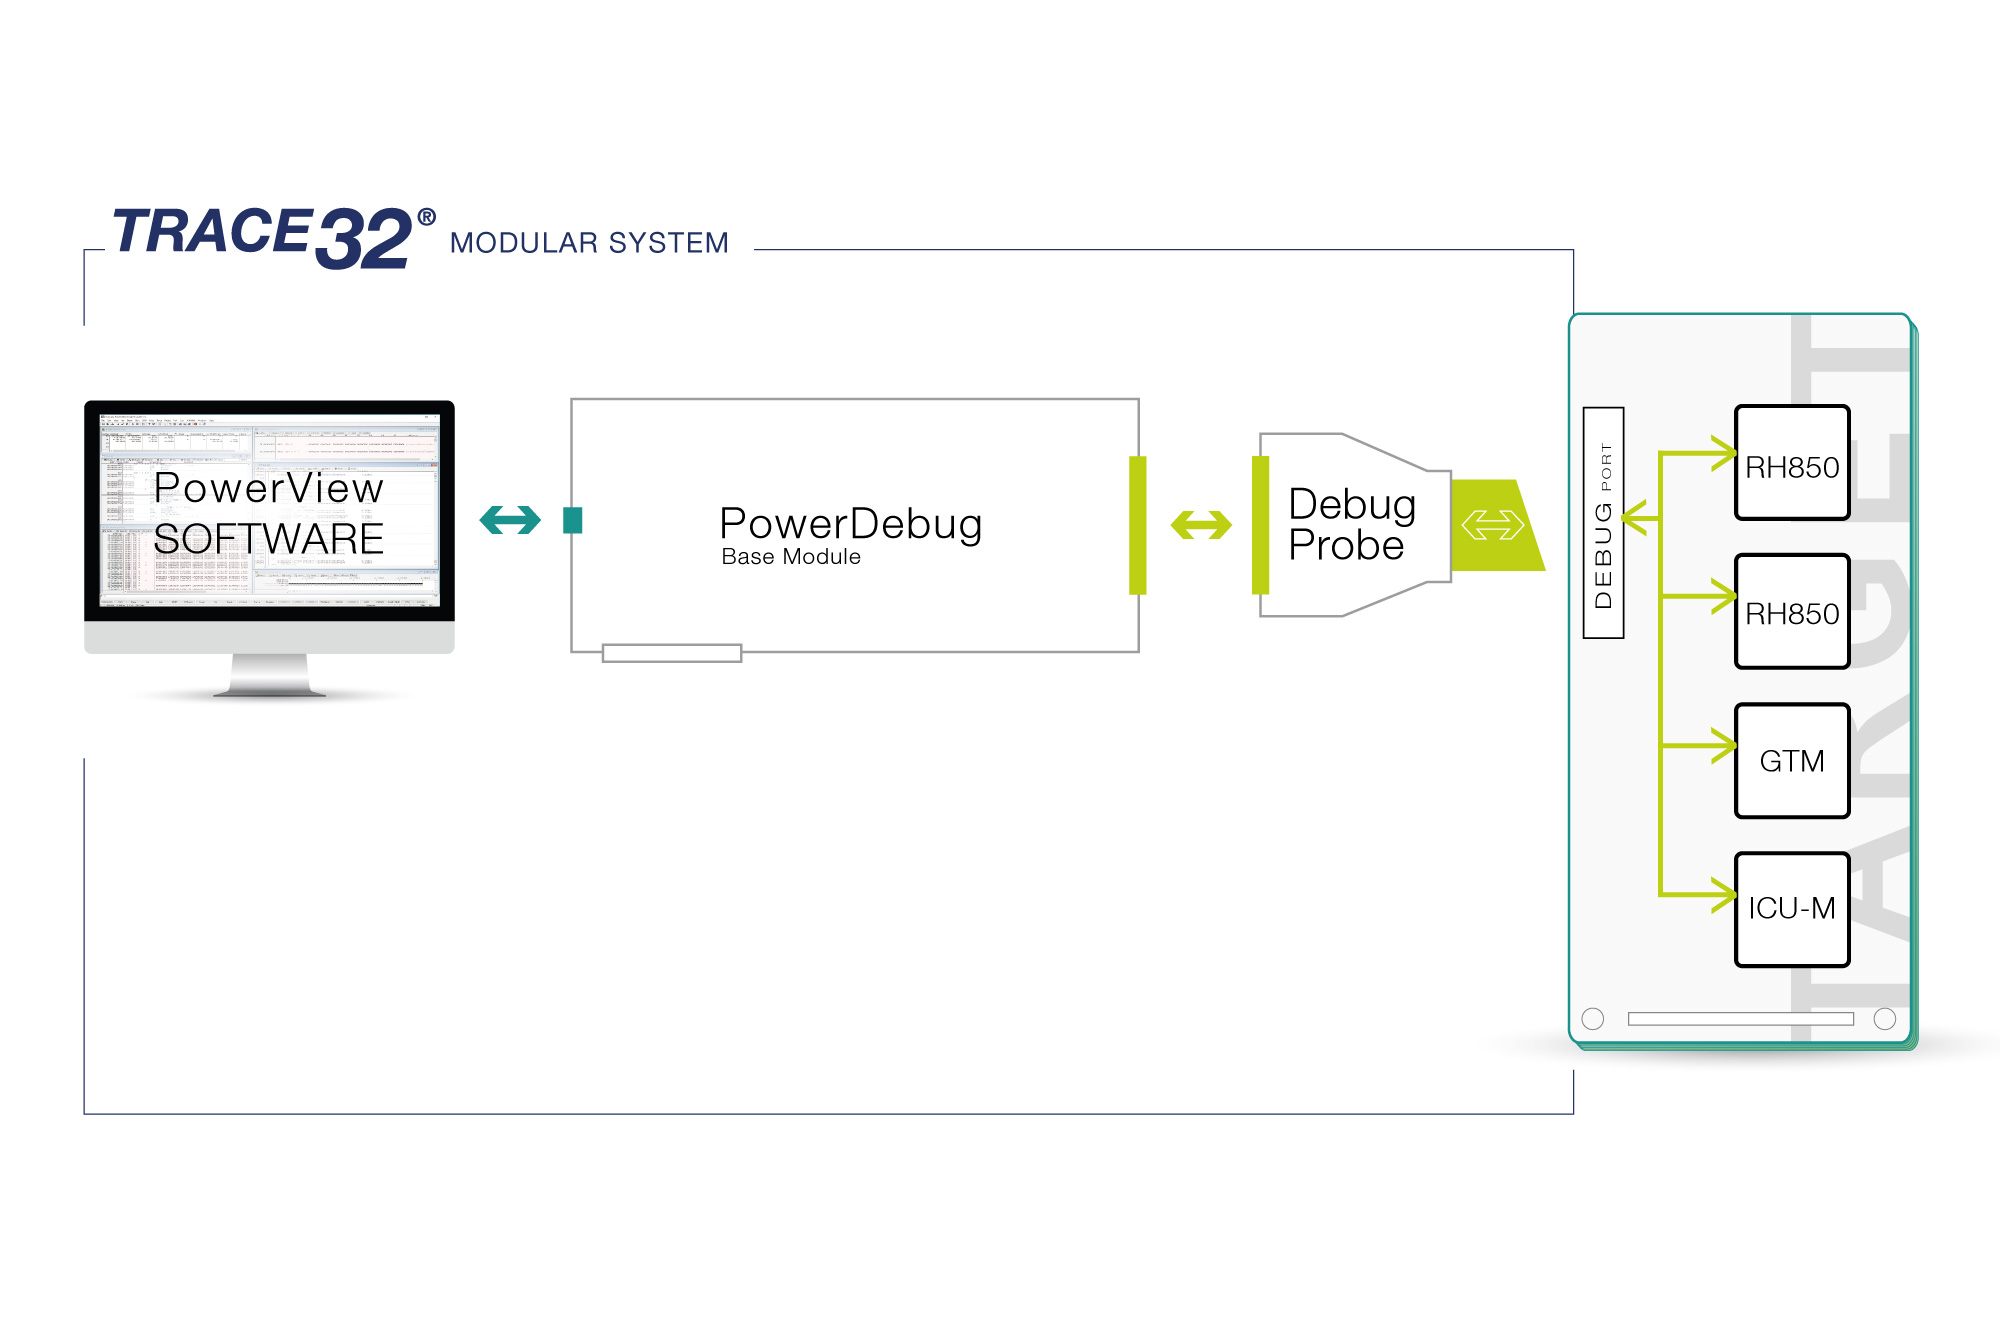
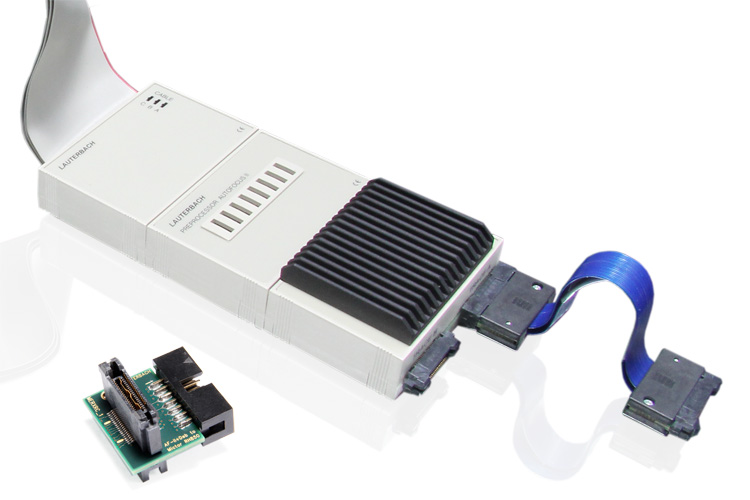
Control and trace the RH850 cores in your chip using a single Lauterbach debugger. Choose from any of the Renesas RH850 family of 32-bit microcontrollers (MCUs) found in many advanced automotive applications. From very low power single-core chips up to high performance multicore chips, your RH850 application can be improved using Lauterbach Trace32 Debug Tools.
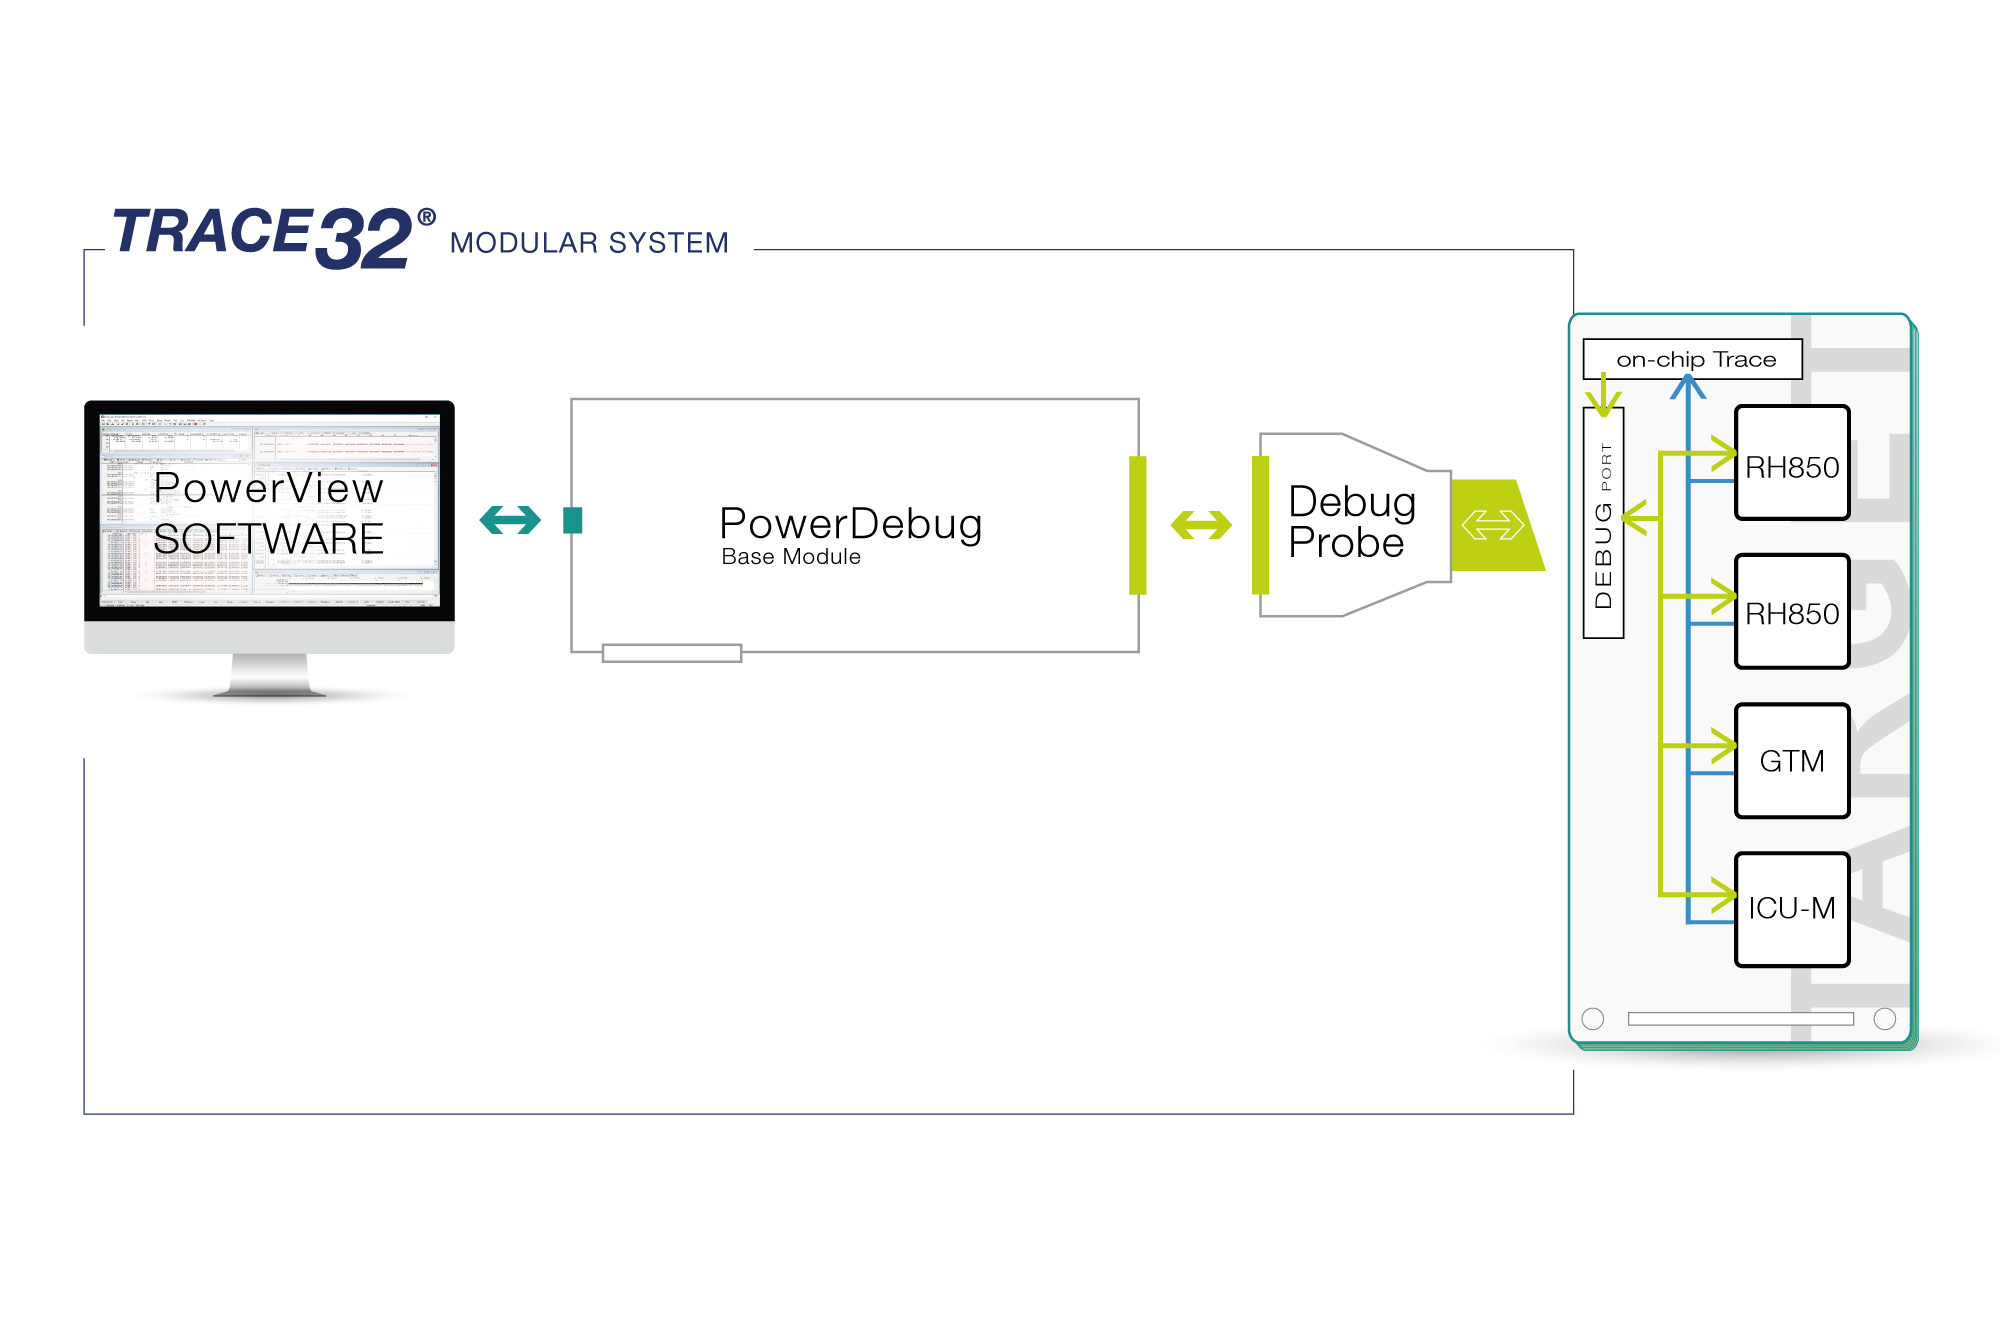
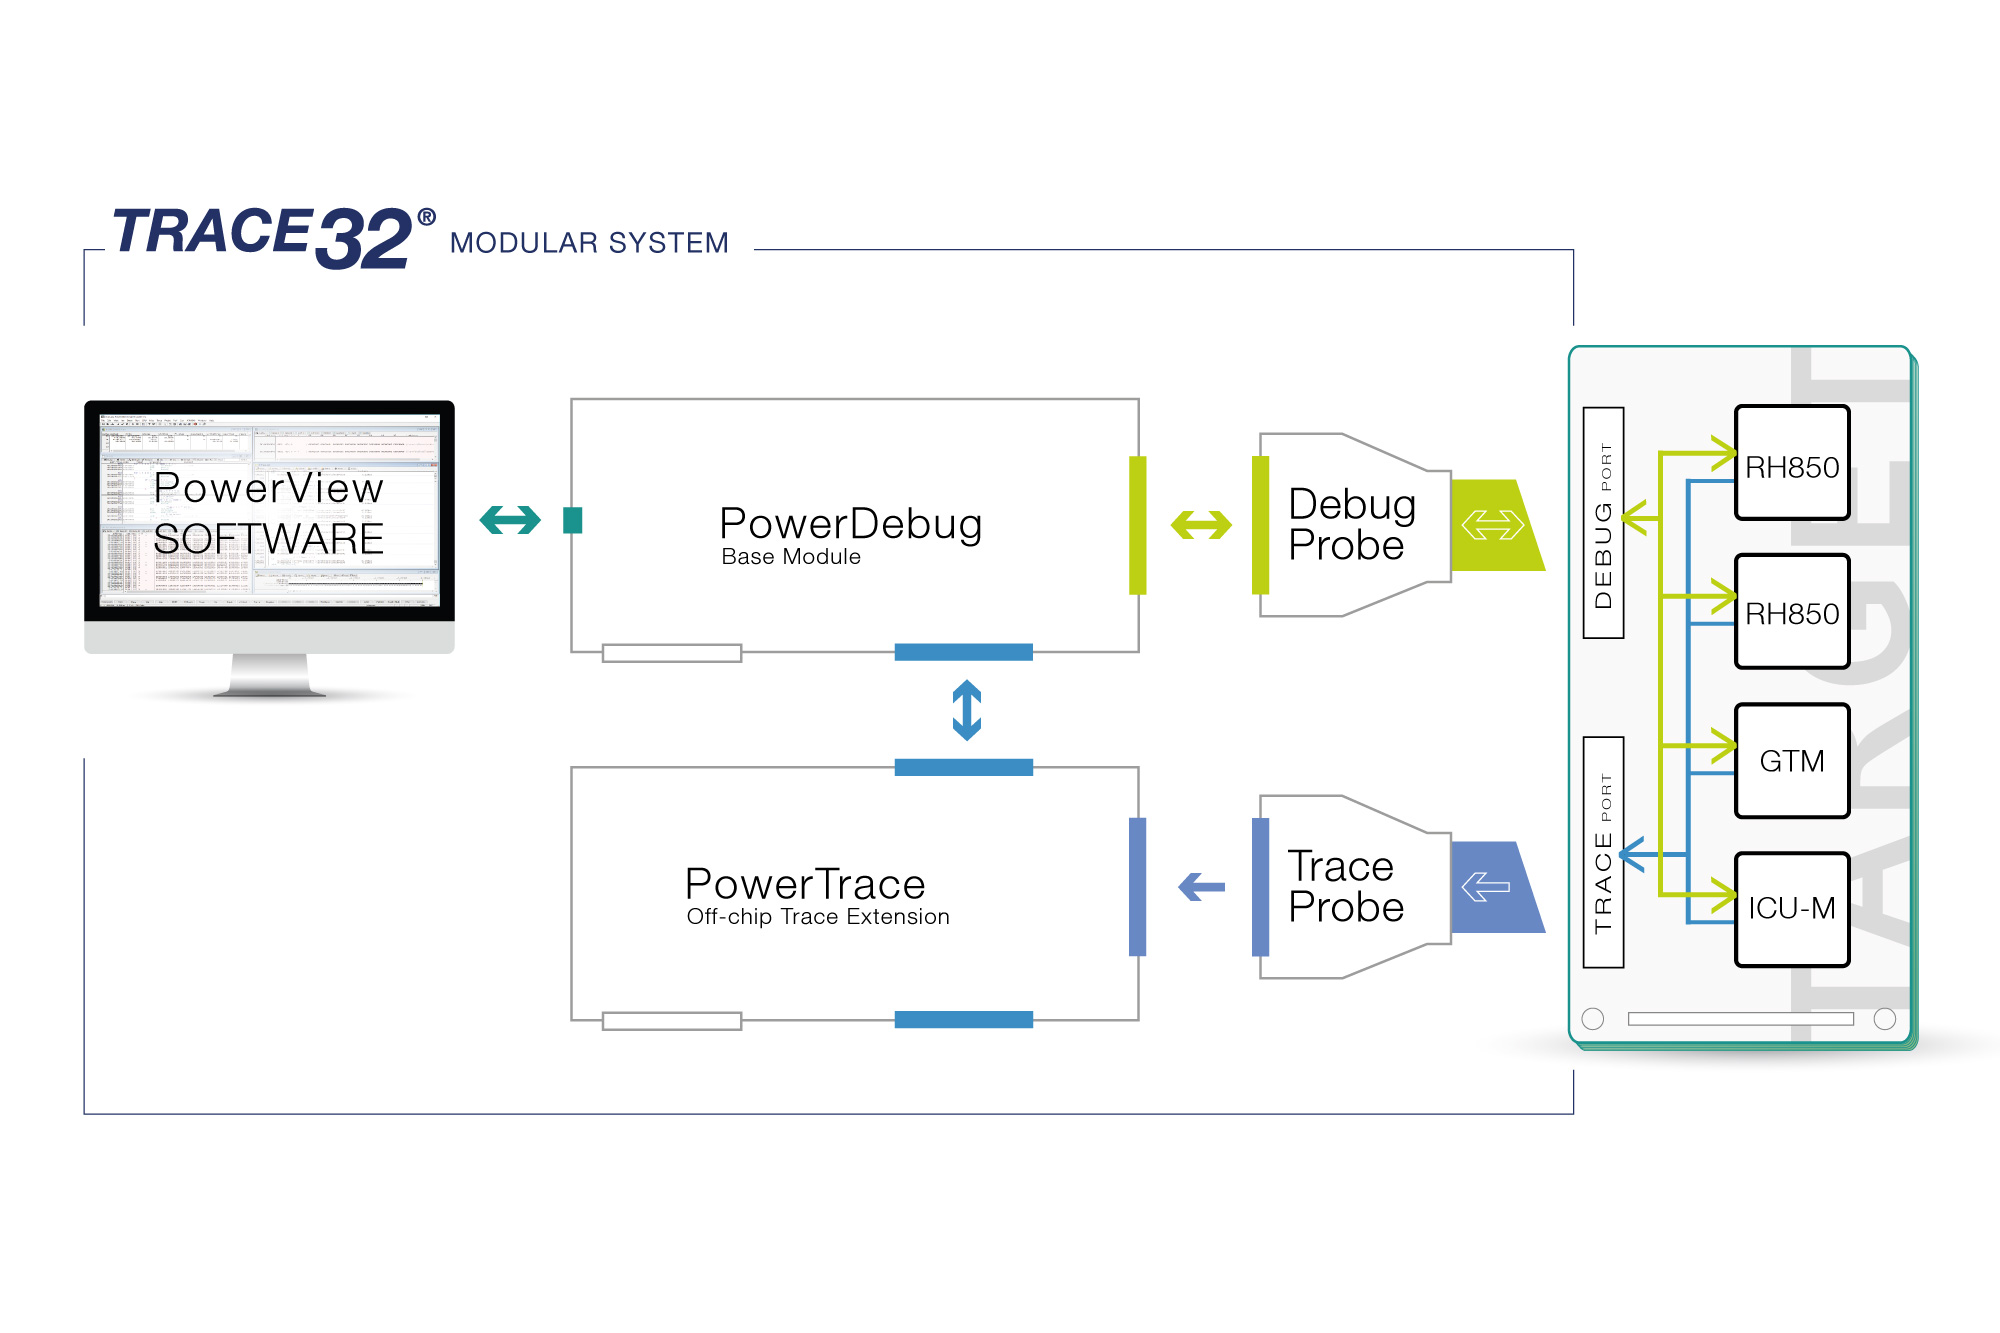
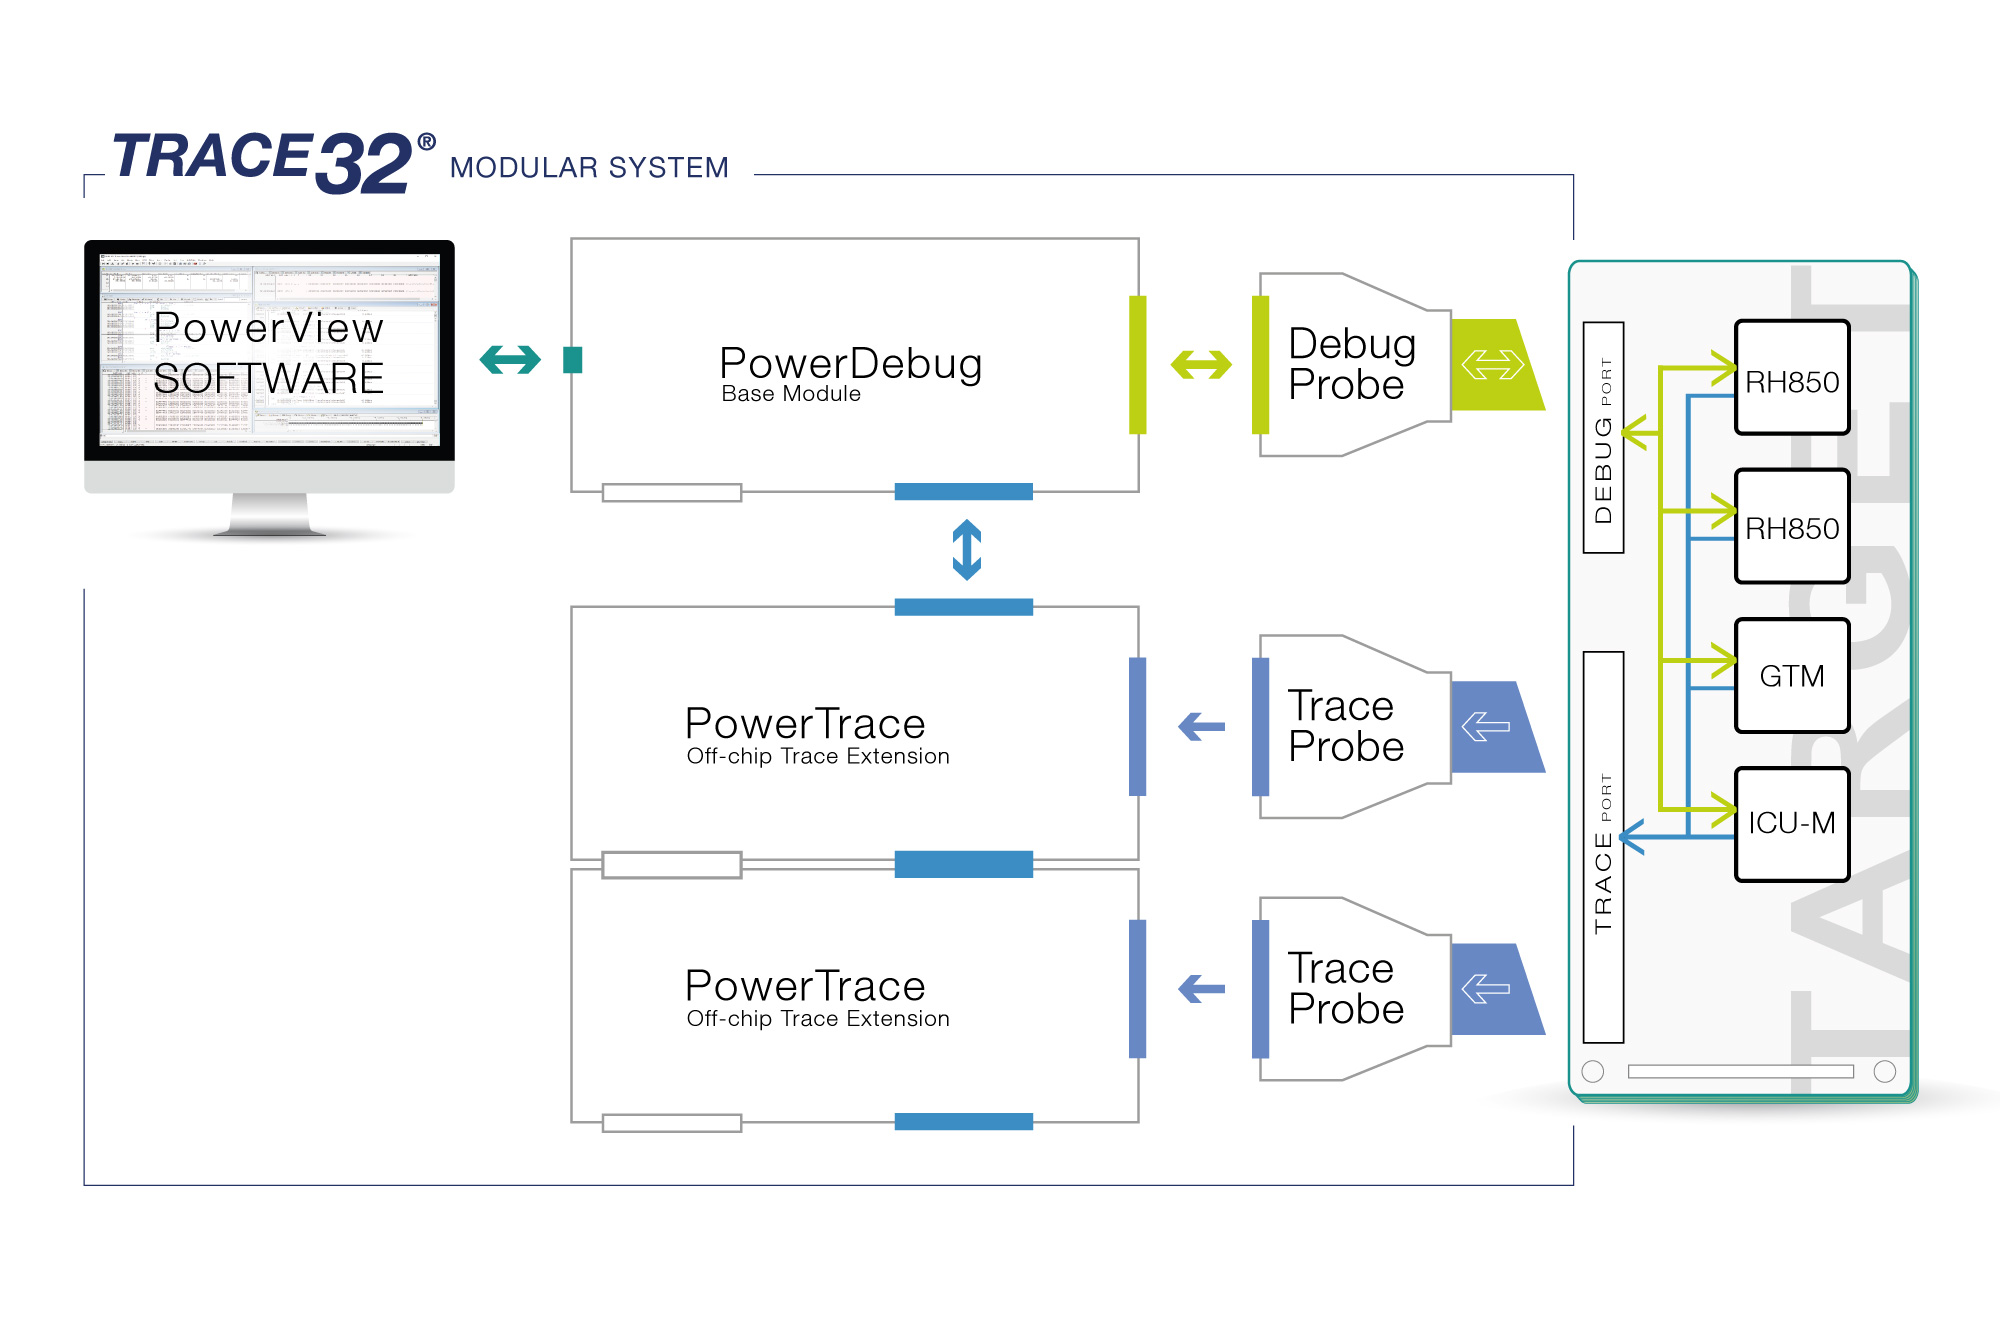
Whichever method you use to communicate with your device, TRACE32 can support it. Debug the RH850 over JTAG, LPD4, or LPD1; program using CSI, or UART, even when sharing those ports with calibration tools like ETKx from ETAS. Watch your program execute via onchip-trace, parallel-trace, Aurora trace, or LPD4 (including SFT). Program either external or internal flash directly from the debug environment to streamline your development process.
Supported Sub-Architectures
RH850, V850
Unleash the Power of Your RH850
Explore and utilize all the powerful and well-known features of your RH850 core with Lauterbach TRACE32: full on-chip breakpoint support; run-time memory access; flash programming; benchmark counters; and cache view. And of course, everything is scriptable, enabling you to repeat the same test-sequence over and over.
Learn more about our debug systemWhich RH850 core do you want to use?
Check out our catalogue of predefined solutions and find the ideal toolset for your project.
Capture Your Core’s Actions
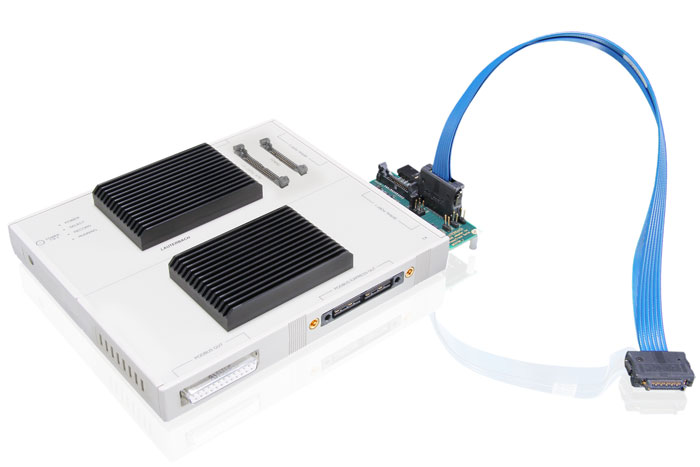
Expand the already powerful TRACE32 stop mode debugging with trace. Explore issues as they occur in real time. Record the actual flow of the program to uncover points of conflict. Halt a program when an error occurs, and inspect each instruction that led to that point, in the order they occurred. Our PowerView debug software supports both the space-efficient onchip trace and the more powerful off-chip trace (parallel-Nexus or Aurora serial trace).
Which RH850 core do you want to use?
Check out our catalogue of predefined solutions and find the ideal toolset for your project.
Get Ready Before Your Silicon is
Start software development on virtual prototypes and simulators, using the same TRACE32 GUI and toolset that you would use later with the real chip. Verify the debug interface of your individual RH850 chip before starting the taping out.
3rd Party Tools Supported for RH850
The following features are available for all architectures supported by TRACE32. Please contact us if your device or tool is not listed here; support is often already on its way.

