PowerDebug System
Modular and Powerful Debug System
PowerDebug is a powerful, modular, flexible debug system that adapts and grows with you as you move from project to project and chip to chip. It provides the broadest coverage of supported chips and core architectures in the embedded industry.
Start with a universal PowerDebug module and target-specific debug probe. Extend your debug system with trace and logic analyzer modules for run-time analysis, code coverage, or in-depth troubleshooting.
Get to Know the Building Blocks
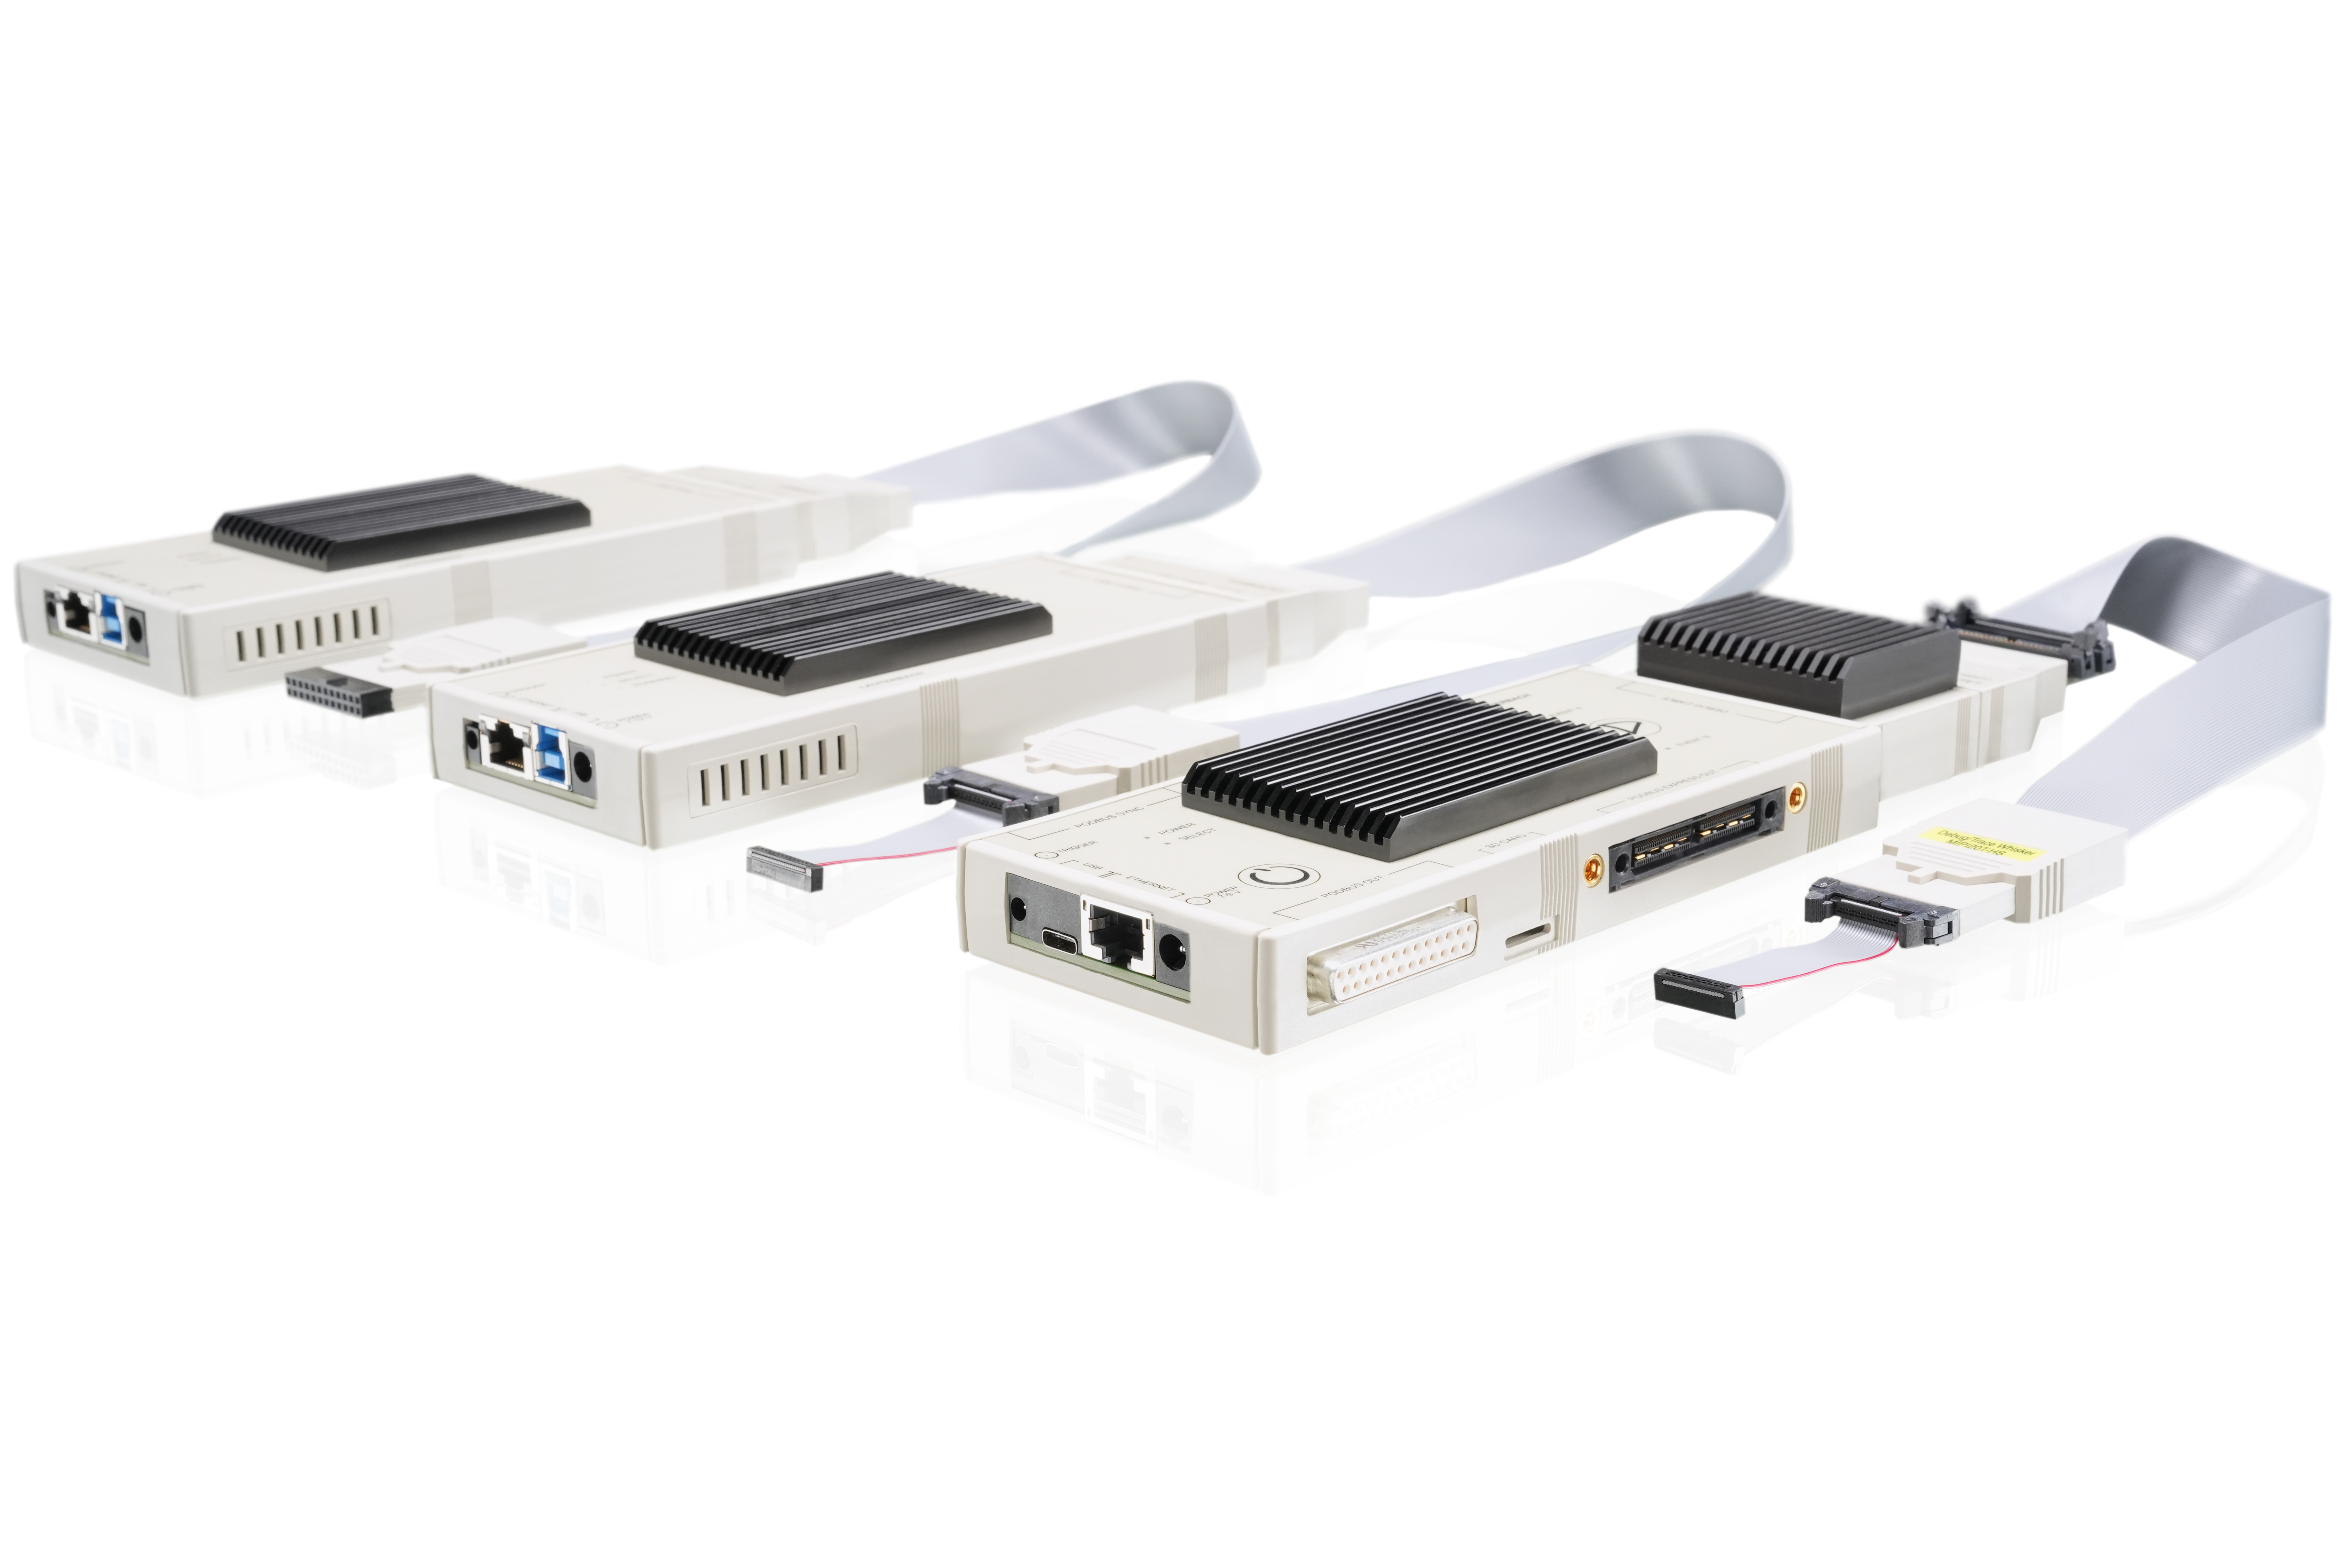
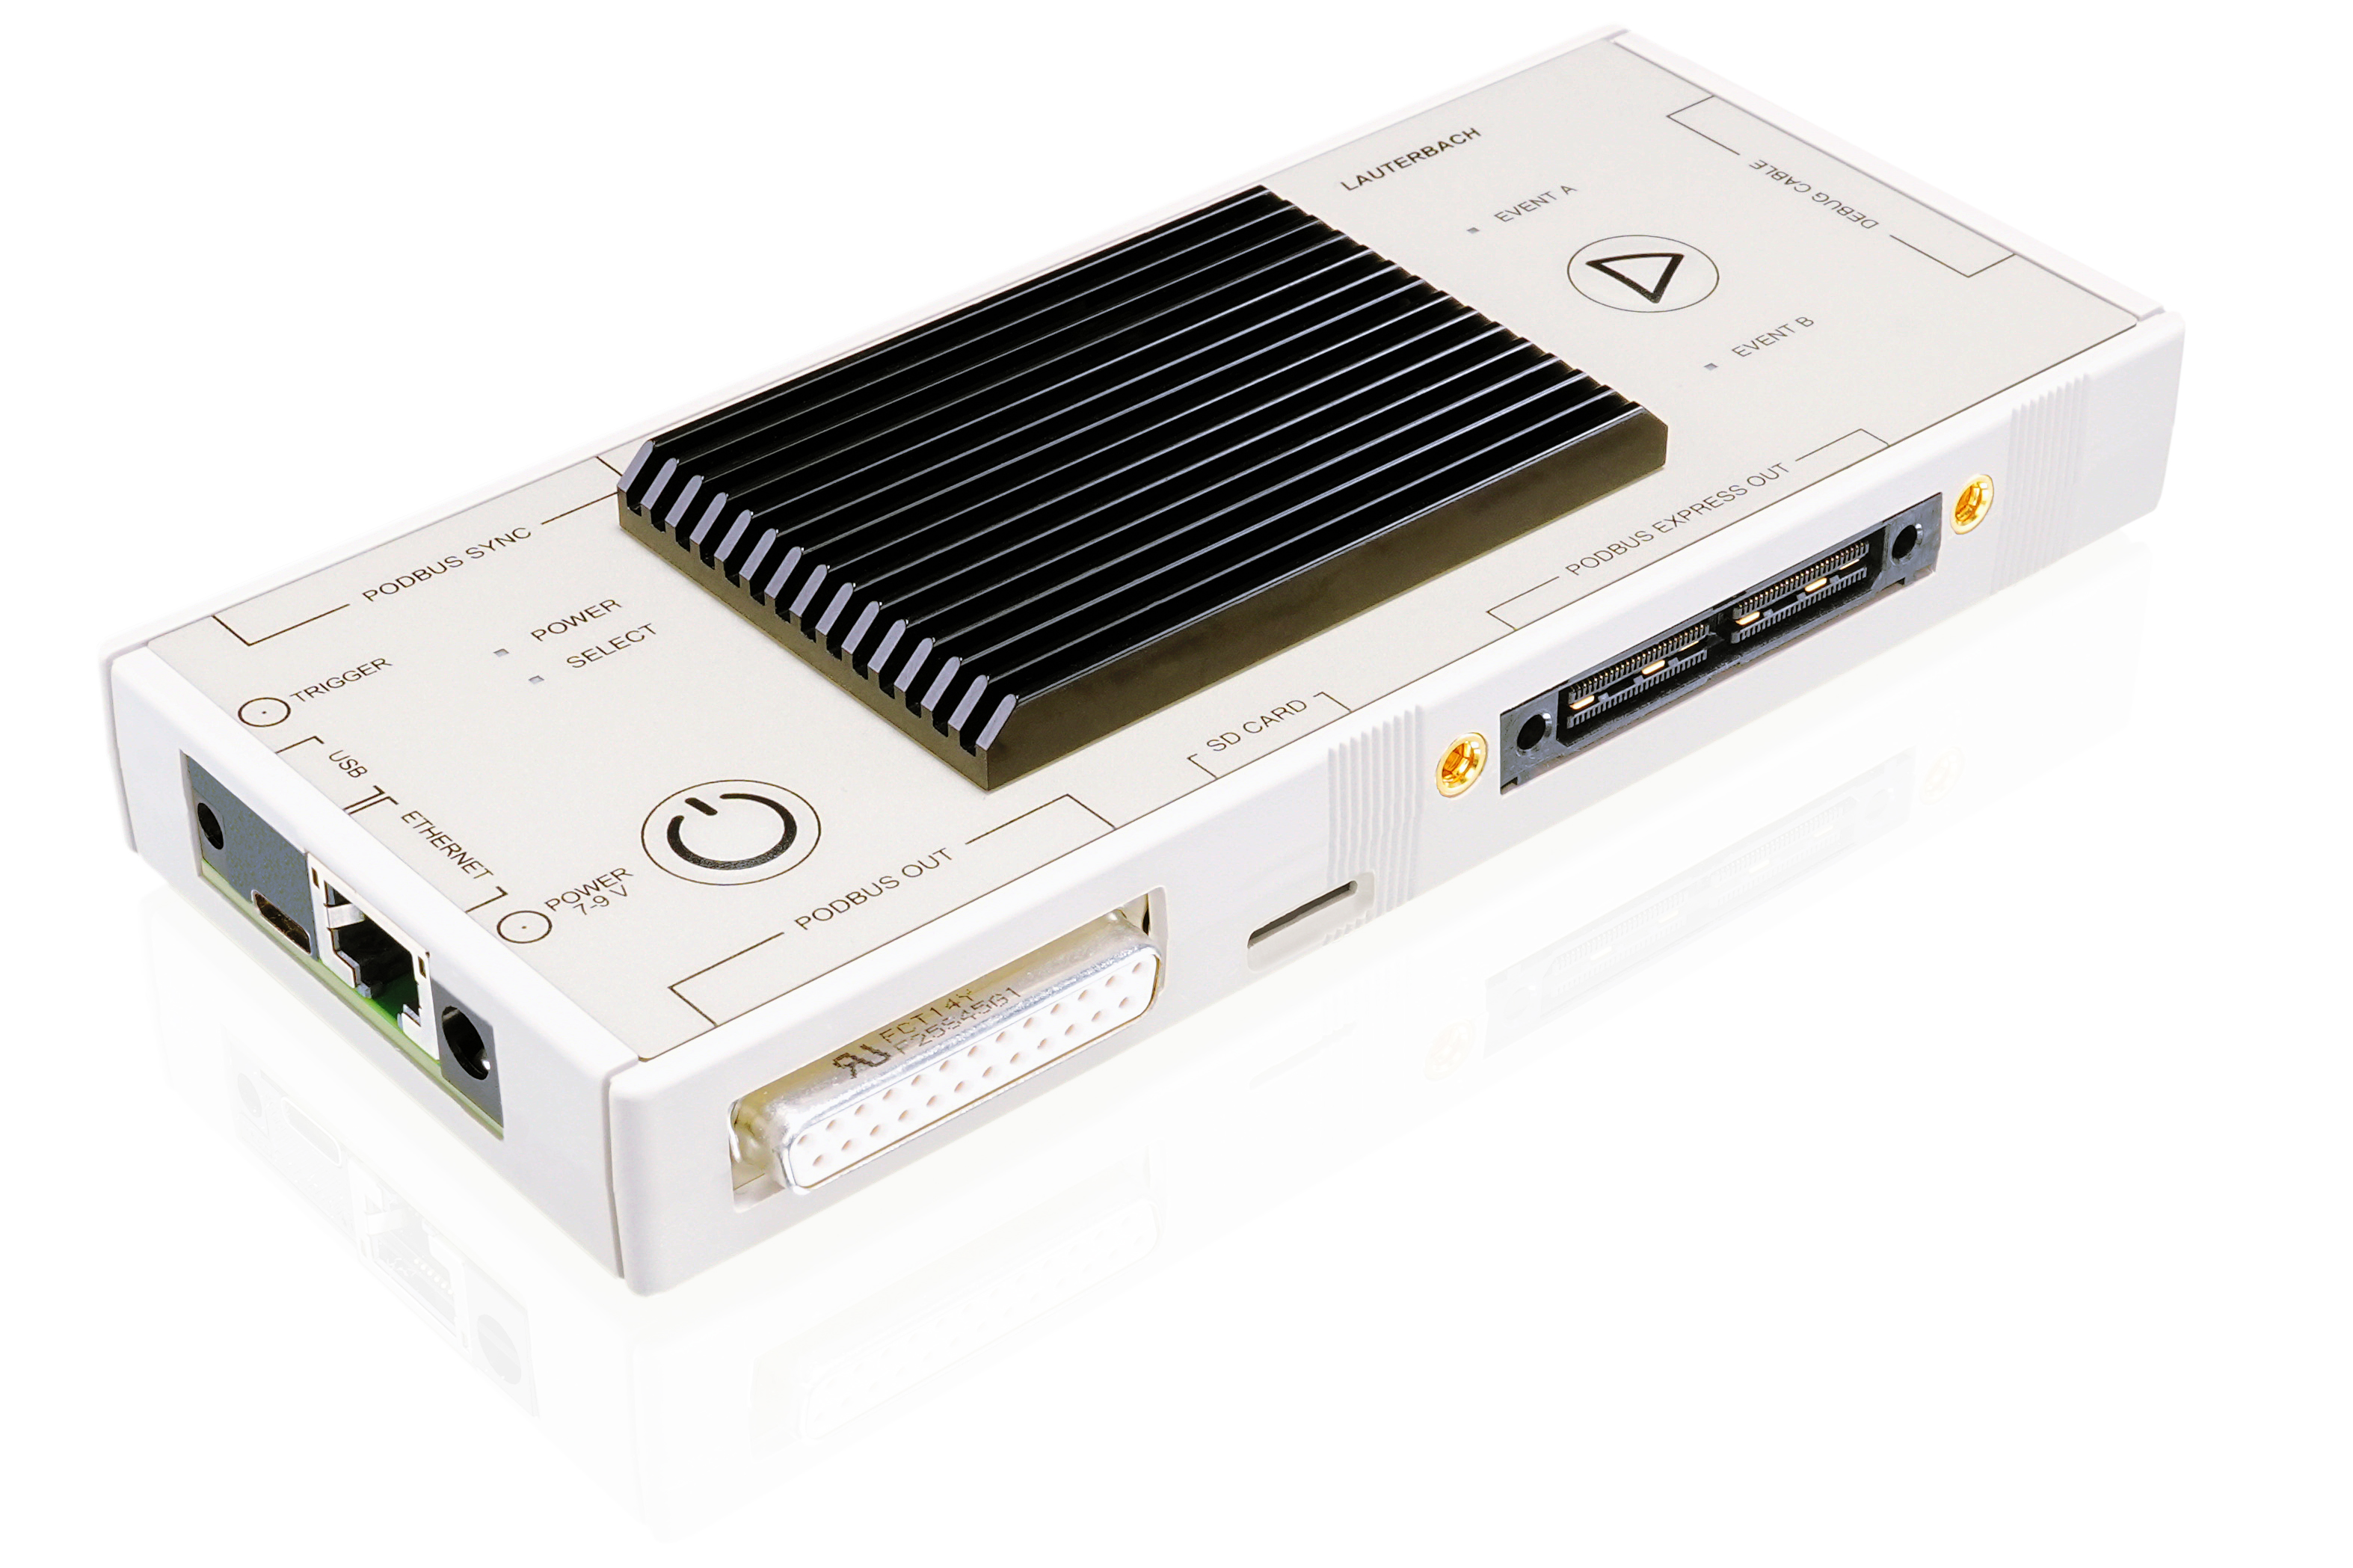
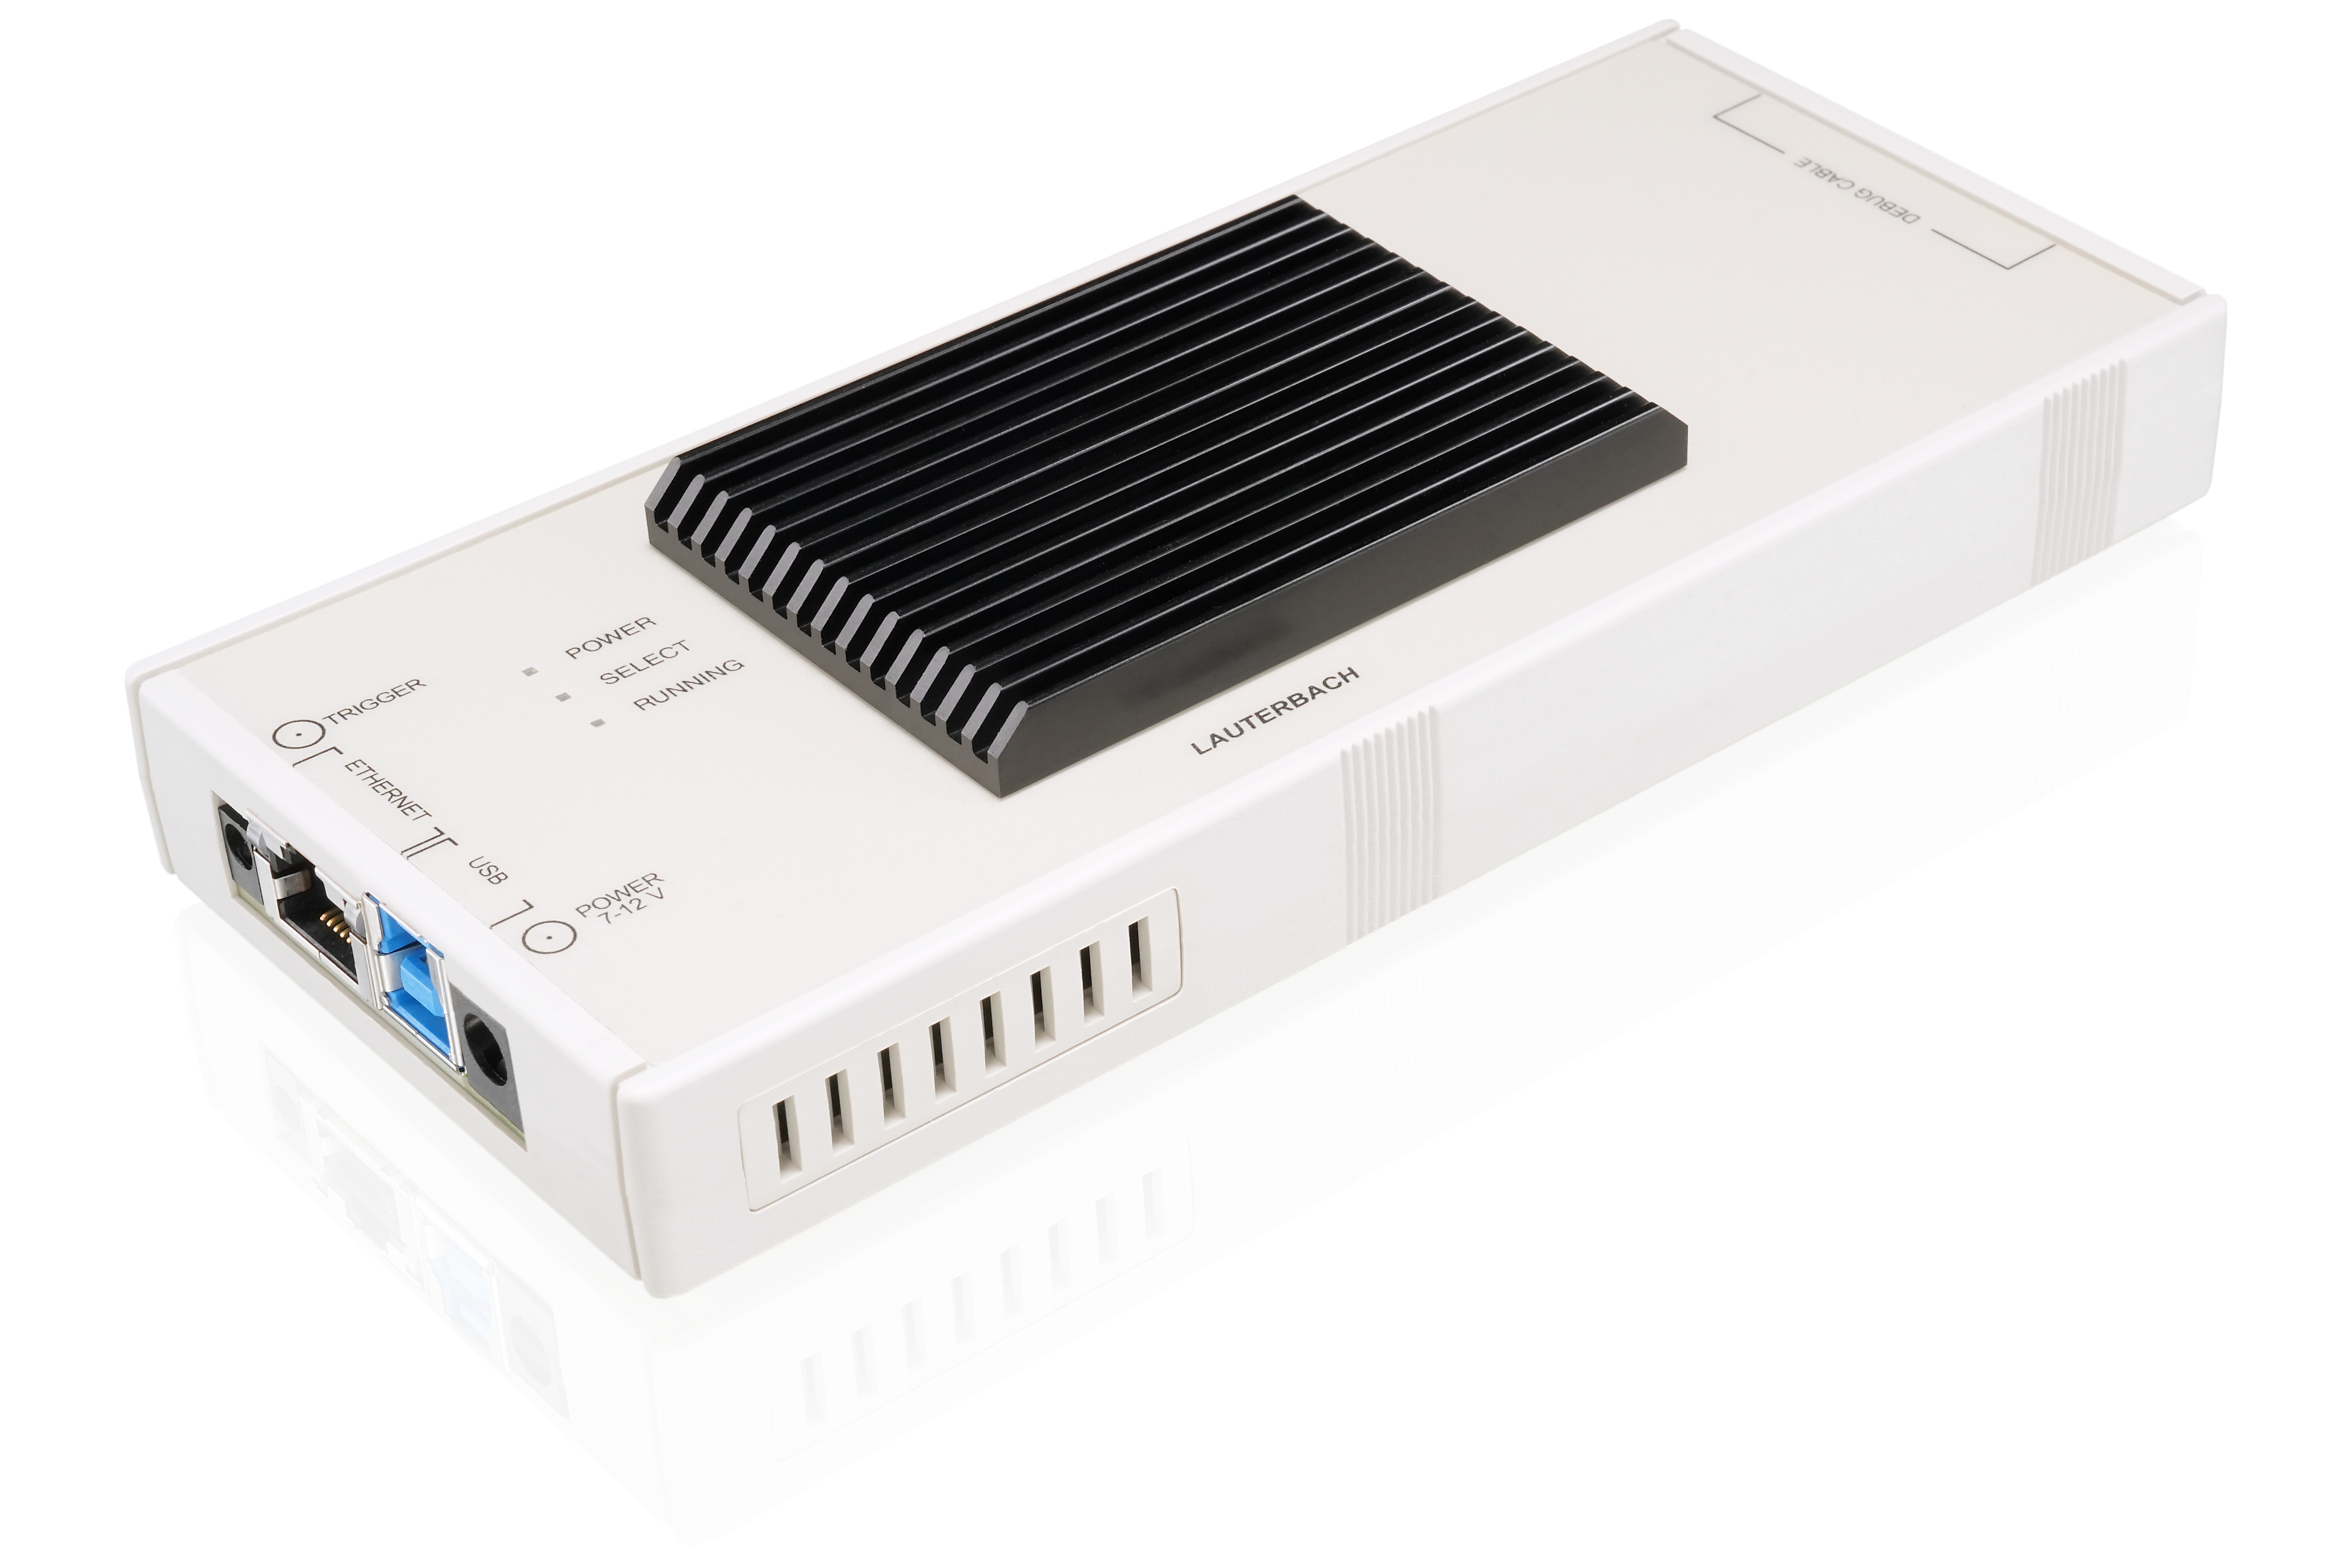
The modular design of the TRACE32 PowerDebug System allows it to grow and adapt to your needs. The foundation of the debug system is a PowerDebug module providing a universal, target-independent connection to your host PC either via USB3 or Gigabit Ethernet. Together with a platform-specific debug probe it forms a complete debug system.

Our foundation for debugging almost every chip
The PowerDebug modules are dedicated debug accelerators, close to the target, to reduce response times, improve upload/download speeds, and off-load many debug decisions from the host. This makes debugging tasks magnitudes faster compared to host-based debug systems, slashing development times and costs.
Connection to Your Target with Highest Signal Integrity
Located between your target and your PowerDebug module is the platform-specific debug probe. It adapts to debug interface specifics like voltage, signals, supported protocols and physical dimensions. The active circuitry located as close as possible to the target processor ensures the highest possible signal integrity.
The debug probe includes the license for the target processor architecture. For concurrent debugging of multiple cores within an SoC, the probe can be licensed for more than one processor architecture.
Different target development boards, as well as final target hardware, may have different mechanical connectors. A range of adapters and convertors are available to map the debug probe to the unit under test.
The CombiProbe is an advanced debug probe with two combined debug and trace ports. It supports 4-bit trace ports for system traces or compact flow traces. Additionally, you can connect a Mixed Signal Probe for analyzing digital or analog signals.


Architecture-specific Debug Probes
Specialized debug probes dedicated to specific target platforms.
Discover moreJTAG (IEEE 1149.1)
JTAG is the communication protocol commonly available with most CPUs. Originally developed for Boundary Scan device testing, JTAG allows an external tool to communicate with a Test Access Point (TAP) controller inside a chip. A TAP is the access point to the debug infrastructure within a chip. TAPs can be chained to allow the debugging of several cores via a single debug probe.
cJTAG (IEEE 1149.7)
Compact JTAG (cJTAG) is a technology based on JTAG which reduces the pin count of the debug interface by serializing the JTAG communication between the debugger and the core’s Test Access Points (TAPs). Multiple chips can be supported in a star topology. Compared to normal JTAG, it saves costs for physical pins with a slightly reduced debug performance.
CoreSight Serial Wire Debug (SWD)
SWD (Serial Wire Debug) is a 2-pin debug interface defined by Arm®, which is optimized to access the CoreSight™ debug infrastructure with maximum performance.
Infineon DAP
The Infineon Device Access Port (DAP) is a versatile debug interface with two or more pins. Its CRC6 protection makes it robust in noisy environments. It supports much higher frequencies than JTAG which even allows transmitting trace data with low- to medium bandwidth.
Nexus (IEEE 5001)
Nexus defines a standard for the debugging and tracing of embedded processors. Most modern Nexus-compliant chips provide regular JTAG for debugging and use an extra auxiliary port only for transmitting real-time trace data. However, some chips like the MPC56x and MP63x use a parallel auxiliary port in full-duplex mode for both debugging and tracing.
BDM
The Background Debug Mode (BDM) provides a serial shift register protocol for on-chip debugging. Originally designed by Motorola/Freescale it is used for devices of NXP’s ColdFire, M68K, MPC55x, and PowerQuicc families. A variant is the Single-Wire BDM used with S12/S12X/S12Z devices.
Renesas LPD / UART Mode
Low pin debug (LPD) mode is a Renesas specific debug protocol. It is available as LPD4 (4-pin) and LPD1 (1-pin). LPD4 mode also supports low bandwidth and software traces (SFT). For serial flash programming, the Renesas debug protocol further supports asynchronous and synchronous interface modes (UART / CSI).
Intel® Out Of Band (OOB) Hosting DCI
The Intel® DCI OOB protocol provides access to the Intel® Direct Connect Interface (DCI) to debug Intel® targets. It uses the pins of the USB 3.2 Gen 2x1 port. It provides early boot access.
Andes Serial Debug Port
Serial Debug Port is a two-wire option for AndesCore™ and RISC-V processors designed by Andes Technology.
Spy-Bi-Wire
Spy-Bi-Wire is a serialized JTAG protocol (similar to cJTAG) developed by Texas Instruments and available on some MSP430 microcontrollers in addition to normal JTAG. By using Spy-Bi-Wire four physical pins become available for other purposes.
Spitfire
SPITFIRE™ is a serial protocol based on SPI used to debug Microchip dsPIC® processors via two wires. The AUTO26 debug probe supports also the ICSP protocol to program the flash memory of a dsPIC®.
UPDI
The Unified Program and Debug Interface (UPDI) designed by Microchip is a proprietary protocol to debug and program tinyAVR® and megaAVR® devices through a single pin, which is also the chip’s reset pin. These devices can also be programmed via a Serial Peripheral Interface (SPI).
Renesas Single-Wire UART
RL78 processors are debugged via a UART like 1-line debug interface using the pins RESET and TOOL0, while the older 78K0R processors use an additional signal TOOL1.
eJTAG
Extends the IEEE 1149.1 JTAG specification to provide a custom debug interface for MIPS-based processors and SoCs.
I3C
The Improved Inter-Integrated Circuit (I3C) is a next-generation communication protocol developed by the MIPI Alliance to overcome the limitations of I2C and SPI. It provides a high-speed, low-power interface designed for advanced communication while maintaining backward compatibility with I2C.
New and Emerging Technologies
TRACE32 works at the forefront of debugging technologies and tools. Lauterbach engineers are often members of working groups and steering committees for all manner of embedded matters. Some of these new interfaces include SPI debugging, DCI-OOB, debug over USB, debug over CAN, and more.
Power Up Your Debugger
A comprehensive range of add-on modules are available to extend the capabilities of your debug system, allowing it to be as flexible as you need it to be and as adaptable as we could make it.

Trace Extensions
Many modern embedded processors include a trace option which generates real-time, non-intrusive program flow information, or data trace, or the monitoring of device resources, or sometimes all of the above. Adding a trace tool to your setup incorporates this data into your TRACE32 tool suite and opens a range of analysis options: detailed runtime analysis, code coverage, data coverage, as well as task switch analysis. Trace data can be exported to a number of industry standard analysis tools for specific activities.
A wide variety of trace ports and protocols are supported via interchangeable pre-processors and a range of buffer modules, making your trace system as flexible as your debug system. All driven from the same intuitive User Interface, minimising training time and maximising return on investment. Your TRACE32 system is with you for the long haul.
Logic Analysis Extensions
Adding a logic analyser module allows you to sample digital or analogue signals from your embedded system. Cross-trigger between software events, like breakpoints, and real-world signals. Sampling analogue signals alongside program flow allows you to profile application code against the power consumed to execute that code. TRACE32 comes with a number of built-in protocol analysers for common interfaces such as CAN, USB, I2C, and memory buses and can be easily extended to add your own custom protocol analysis capabilities.
Meet our Logic Analysers

Galvanic Isolation
Safely debug your high voltage target using the galvanic isolator. This prevents damage to your tools and PC by isolating the high voltage target signals, allowing you to work safely.