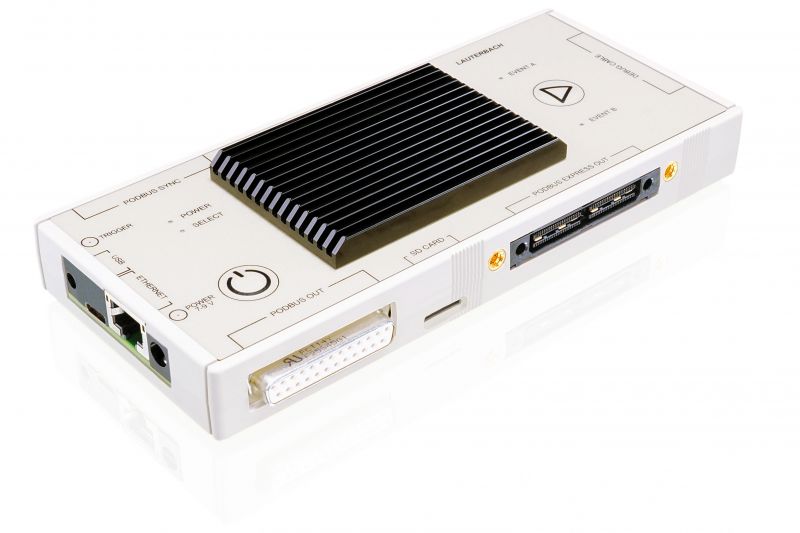
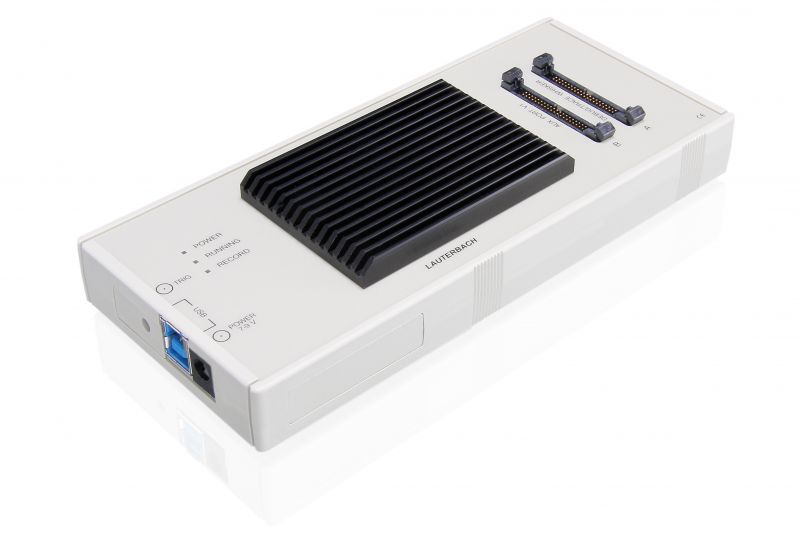
PowerDebug E50
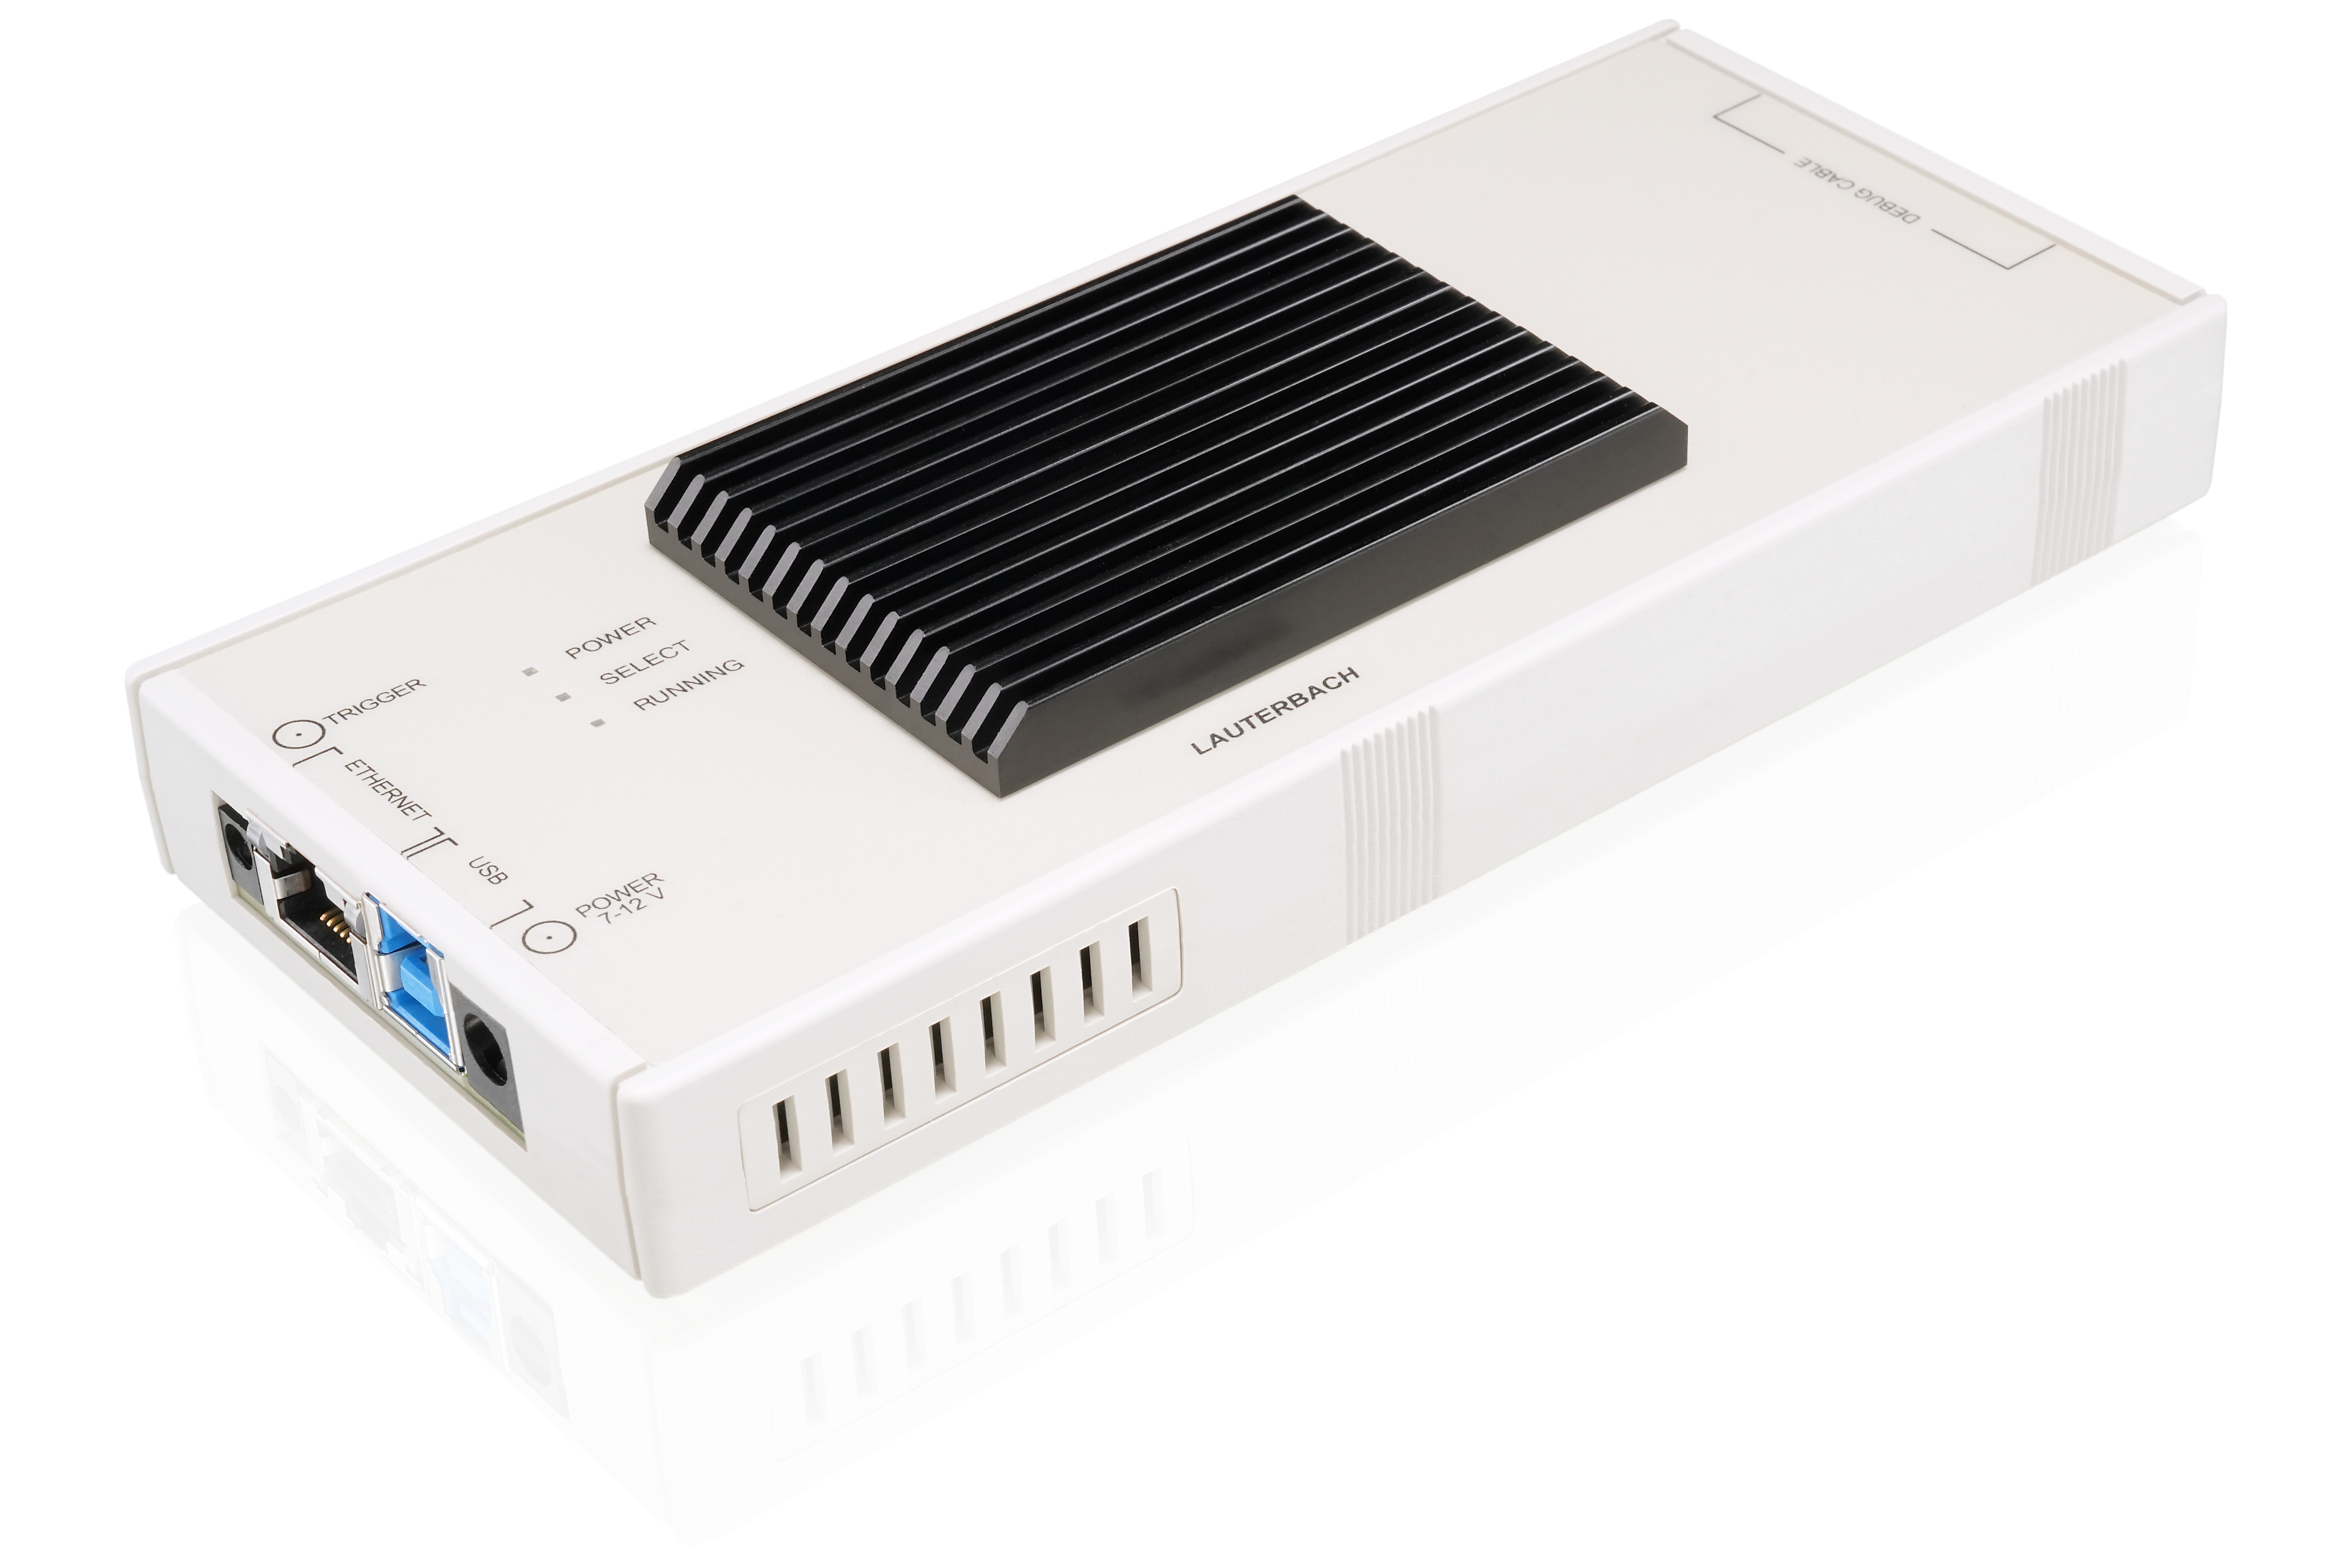
A Powerful Standard Debugger
The PowerDebug E50 is our essential-line debug controller, offering you the performance to help you power through simple and complex debug tasks. It supports high-speed USB 3.0 connections to the host and has an option for Gigabit Ethernet. It can be used with various debug probes and powered by 12V power supplies. Our universal debug tool is designed to maximize your productivity and return on investment.
Your Daily Debug Companion
Focus on today's problems, knowing that we've already got tomorrows covered. Our PowerDebug E50 is a modern, high- performance, flexible tool that allows you to seamlessly transition from one embedded target another. All driven from the same PowerView user interface that has been proven to significantly reduce training time and total cost of ownership.
Universal debug controller
Easily adapt the PowerDebug E50 to support any of more than 15,000 devices and more than 150 chip architectures by simply swapping the debug probe or adding a suitable license.
Super-fast debugging and low response times
The PowerDebug E50 reduces response times and improves upload/ download speeds by placing a dedicated debug hardware accelerator close to the target and off-loading many debug decisions from the host. This makes debugging tasks magnitudes faster compared to host-based debug systems, slashing development times and costs .
Unlimited multi-core debugging
Debug multiple cores at the same time with a single debug probe, no matter the cores ' architectures. Control all cores even in a heterogeneous multi- core RISC cluster with multiple CPUs, DSPs, and other cores via just a single PowerDebug E50 .
Add trace capabilities with CombiProbe
Enhance the features of your PowerDebug E50 by adding a Combi Probe, which provides the ability to support 4-bit off-chip traces. System traces and filtered program flow traces can be recorded, to get more insight on the dynamic behavior of the target application .
Correlate code and external signals
By futher adding a Mixed-Signal-Probe to a CombiProbe plugged to your PowerDebug E50, you can verify signal-timings which are initiated by the application software or identify and optimize power hungry code sections easily.
Move from virtual to real chips seamlessly
If you start your development on emulators, simulators or virtual targets with our PowerView software, you can resuse everything, when debugging and profiling real chips with our PowerDebug E50 in later development stages. Scripts for test automation, feature set and user experience remain the same.
Flexible Target Connection
Switch between different targets without the need to exchange the PowerDebug E50 unit itself. Your PowerDebug E50 connects to your target via a modular debug probe. This probe is the target- specific part of your TRACE32 debug system, including the proper electrical interface and your architecture license .
Multiple target architecture licenses can be added to a single debug probe with a simple digital upgrade. If you have multiple designs with compatible electrical interfaces, you can support them all from one probe. If your multicore design shares a common debug interface, all cores can be debugged simultaneously with a single PowerDebug E50 and a single debug probe . If a new target device uses a different electrical connection, you will only need to update the debug probe, or possibly only purchase a simple adapter, to immediately begin debugging. Your existing PowerDebug E50 and PowerView Software investments will continue to connect you to your target .


Architecture-specific Probes
Specialized debug probes dedicated to specific target platforms.
See detailsTypical TRACE32 Configurations
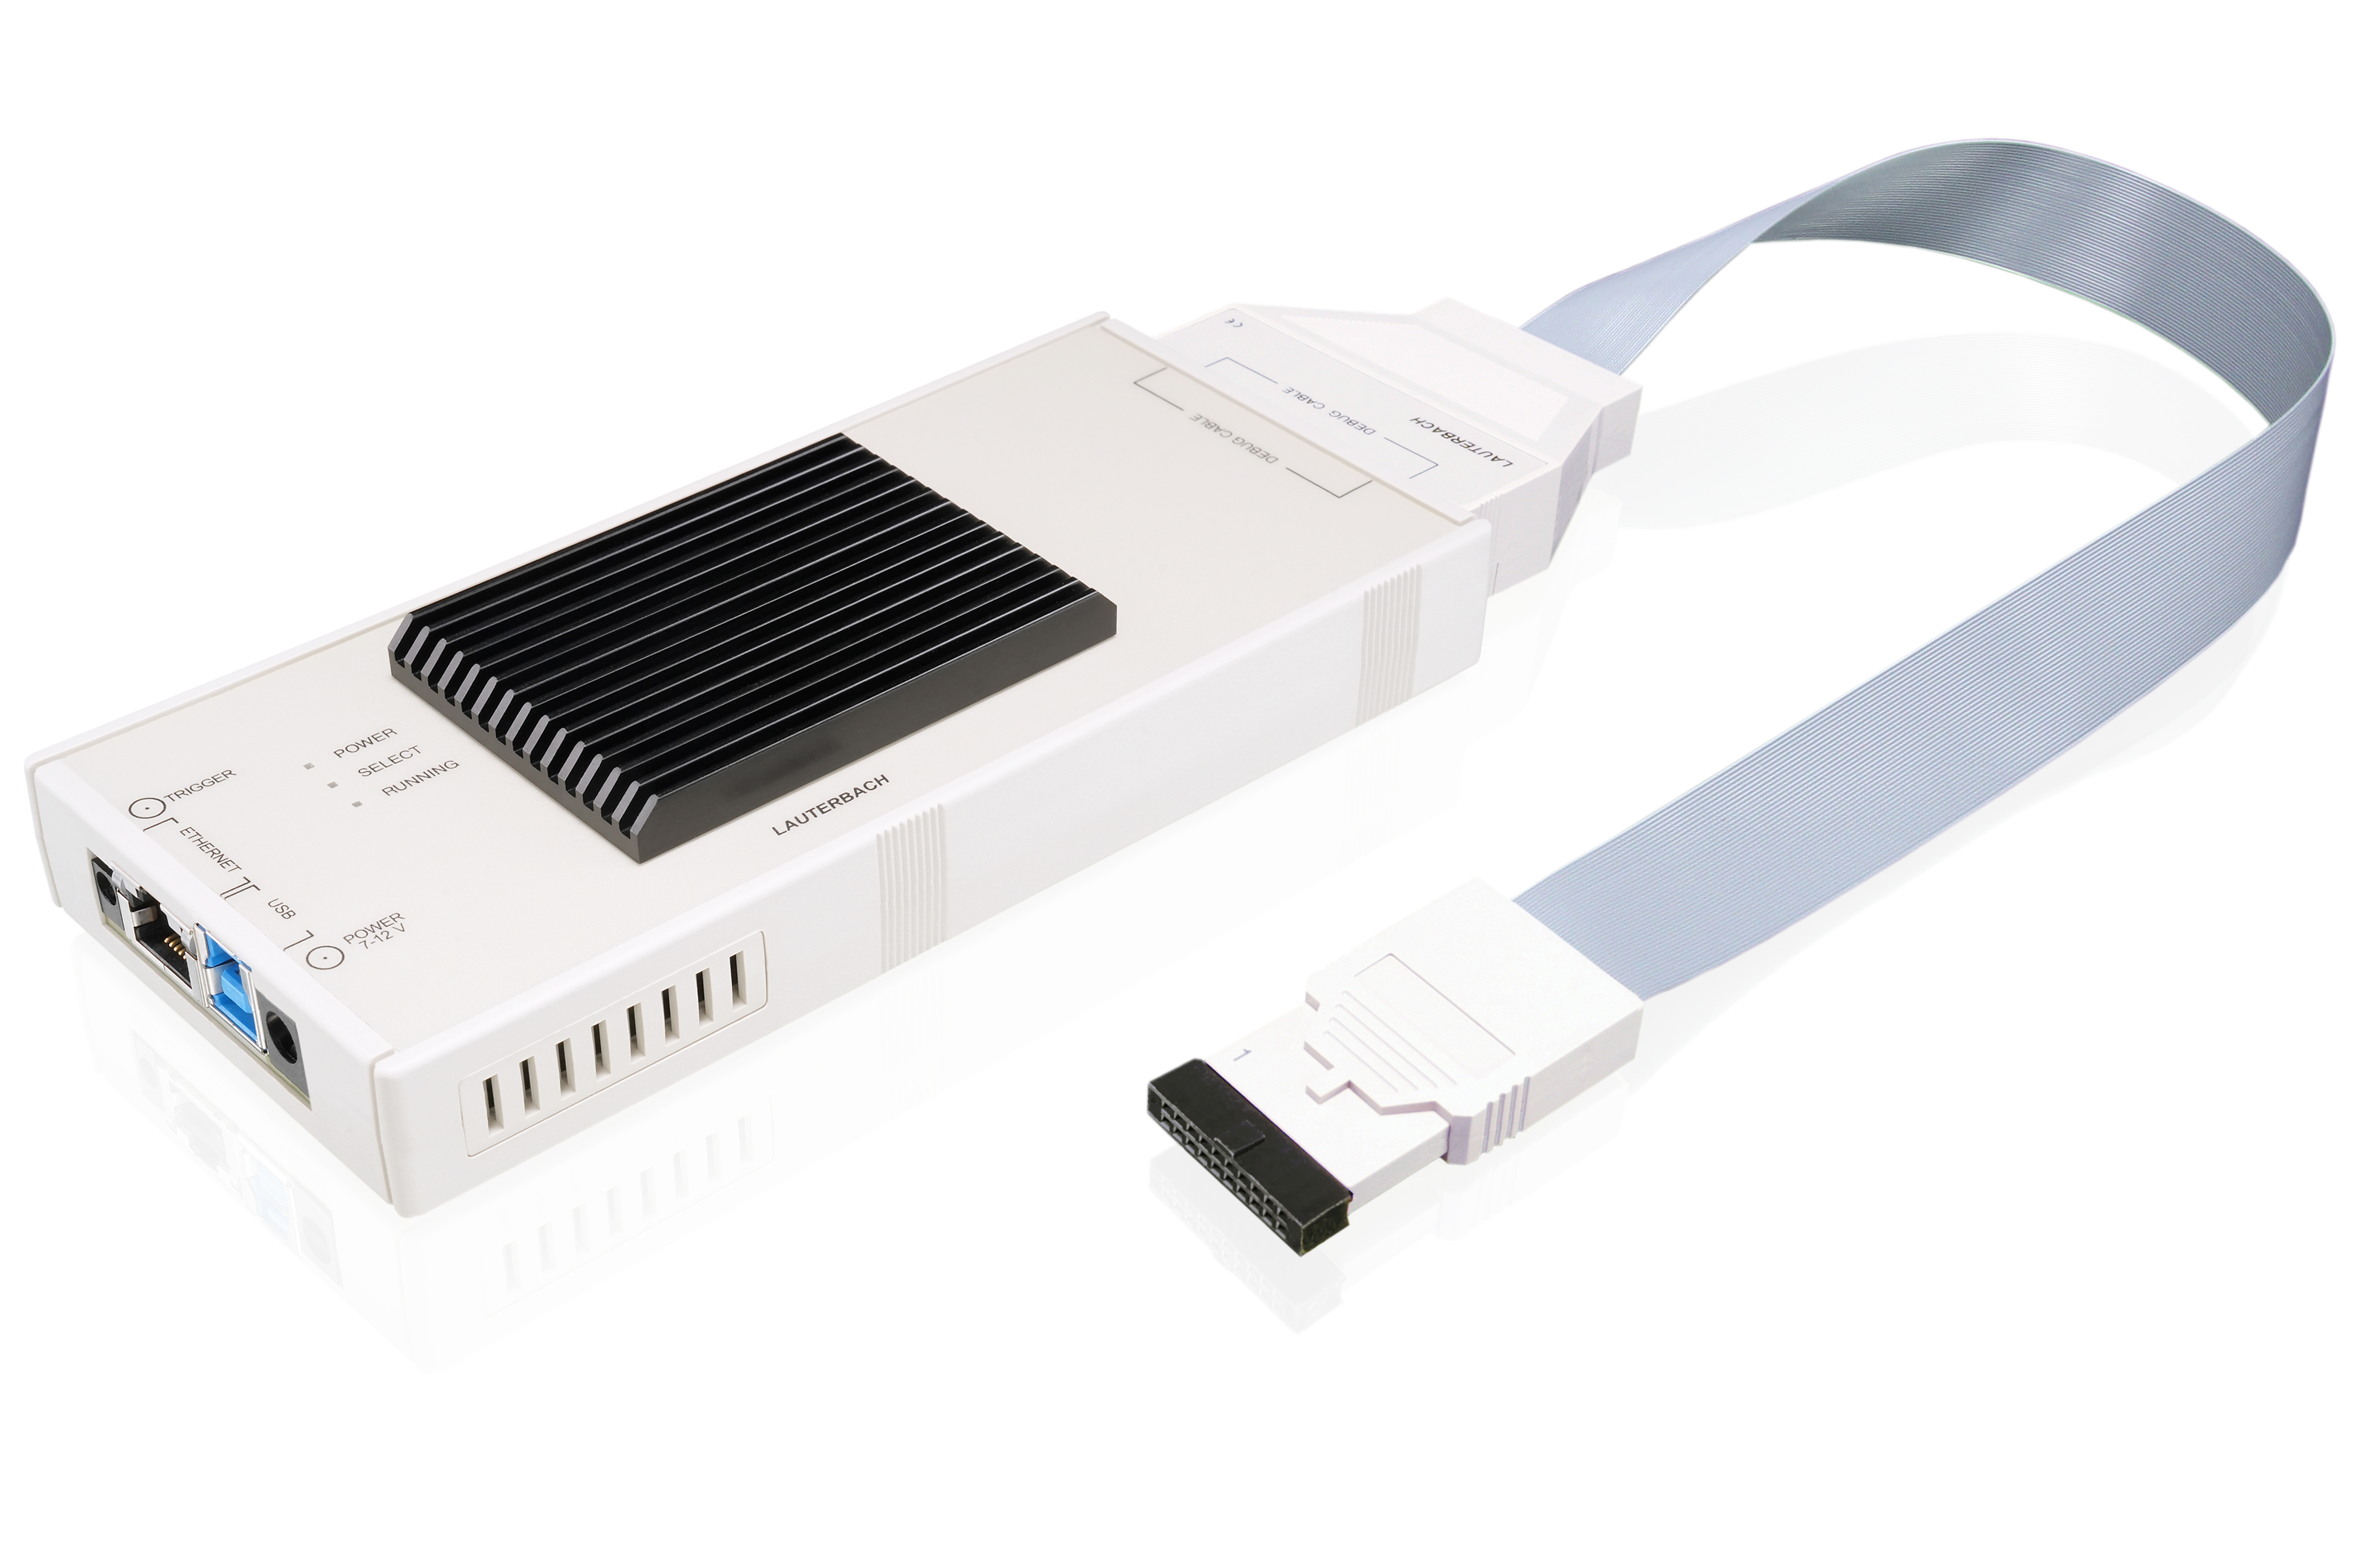
Standard Debugger Configuration
A PowerDebug E50 with an IDC20A Debug Probe provides a standard configuration for debugging of a large number of targets. This configuration is perfectly suited for architectures like Arm Cortex- A/ R/ M, RISC- V, ARC, Xtensa , C6000, Hexagon, and many more .
Products shown:
- PowerDebug E50
- IDC20A Debug Probe
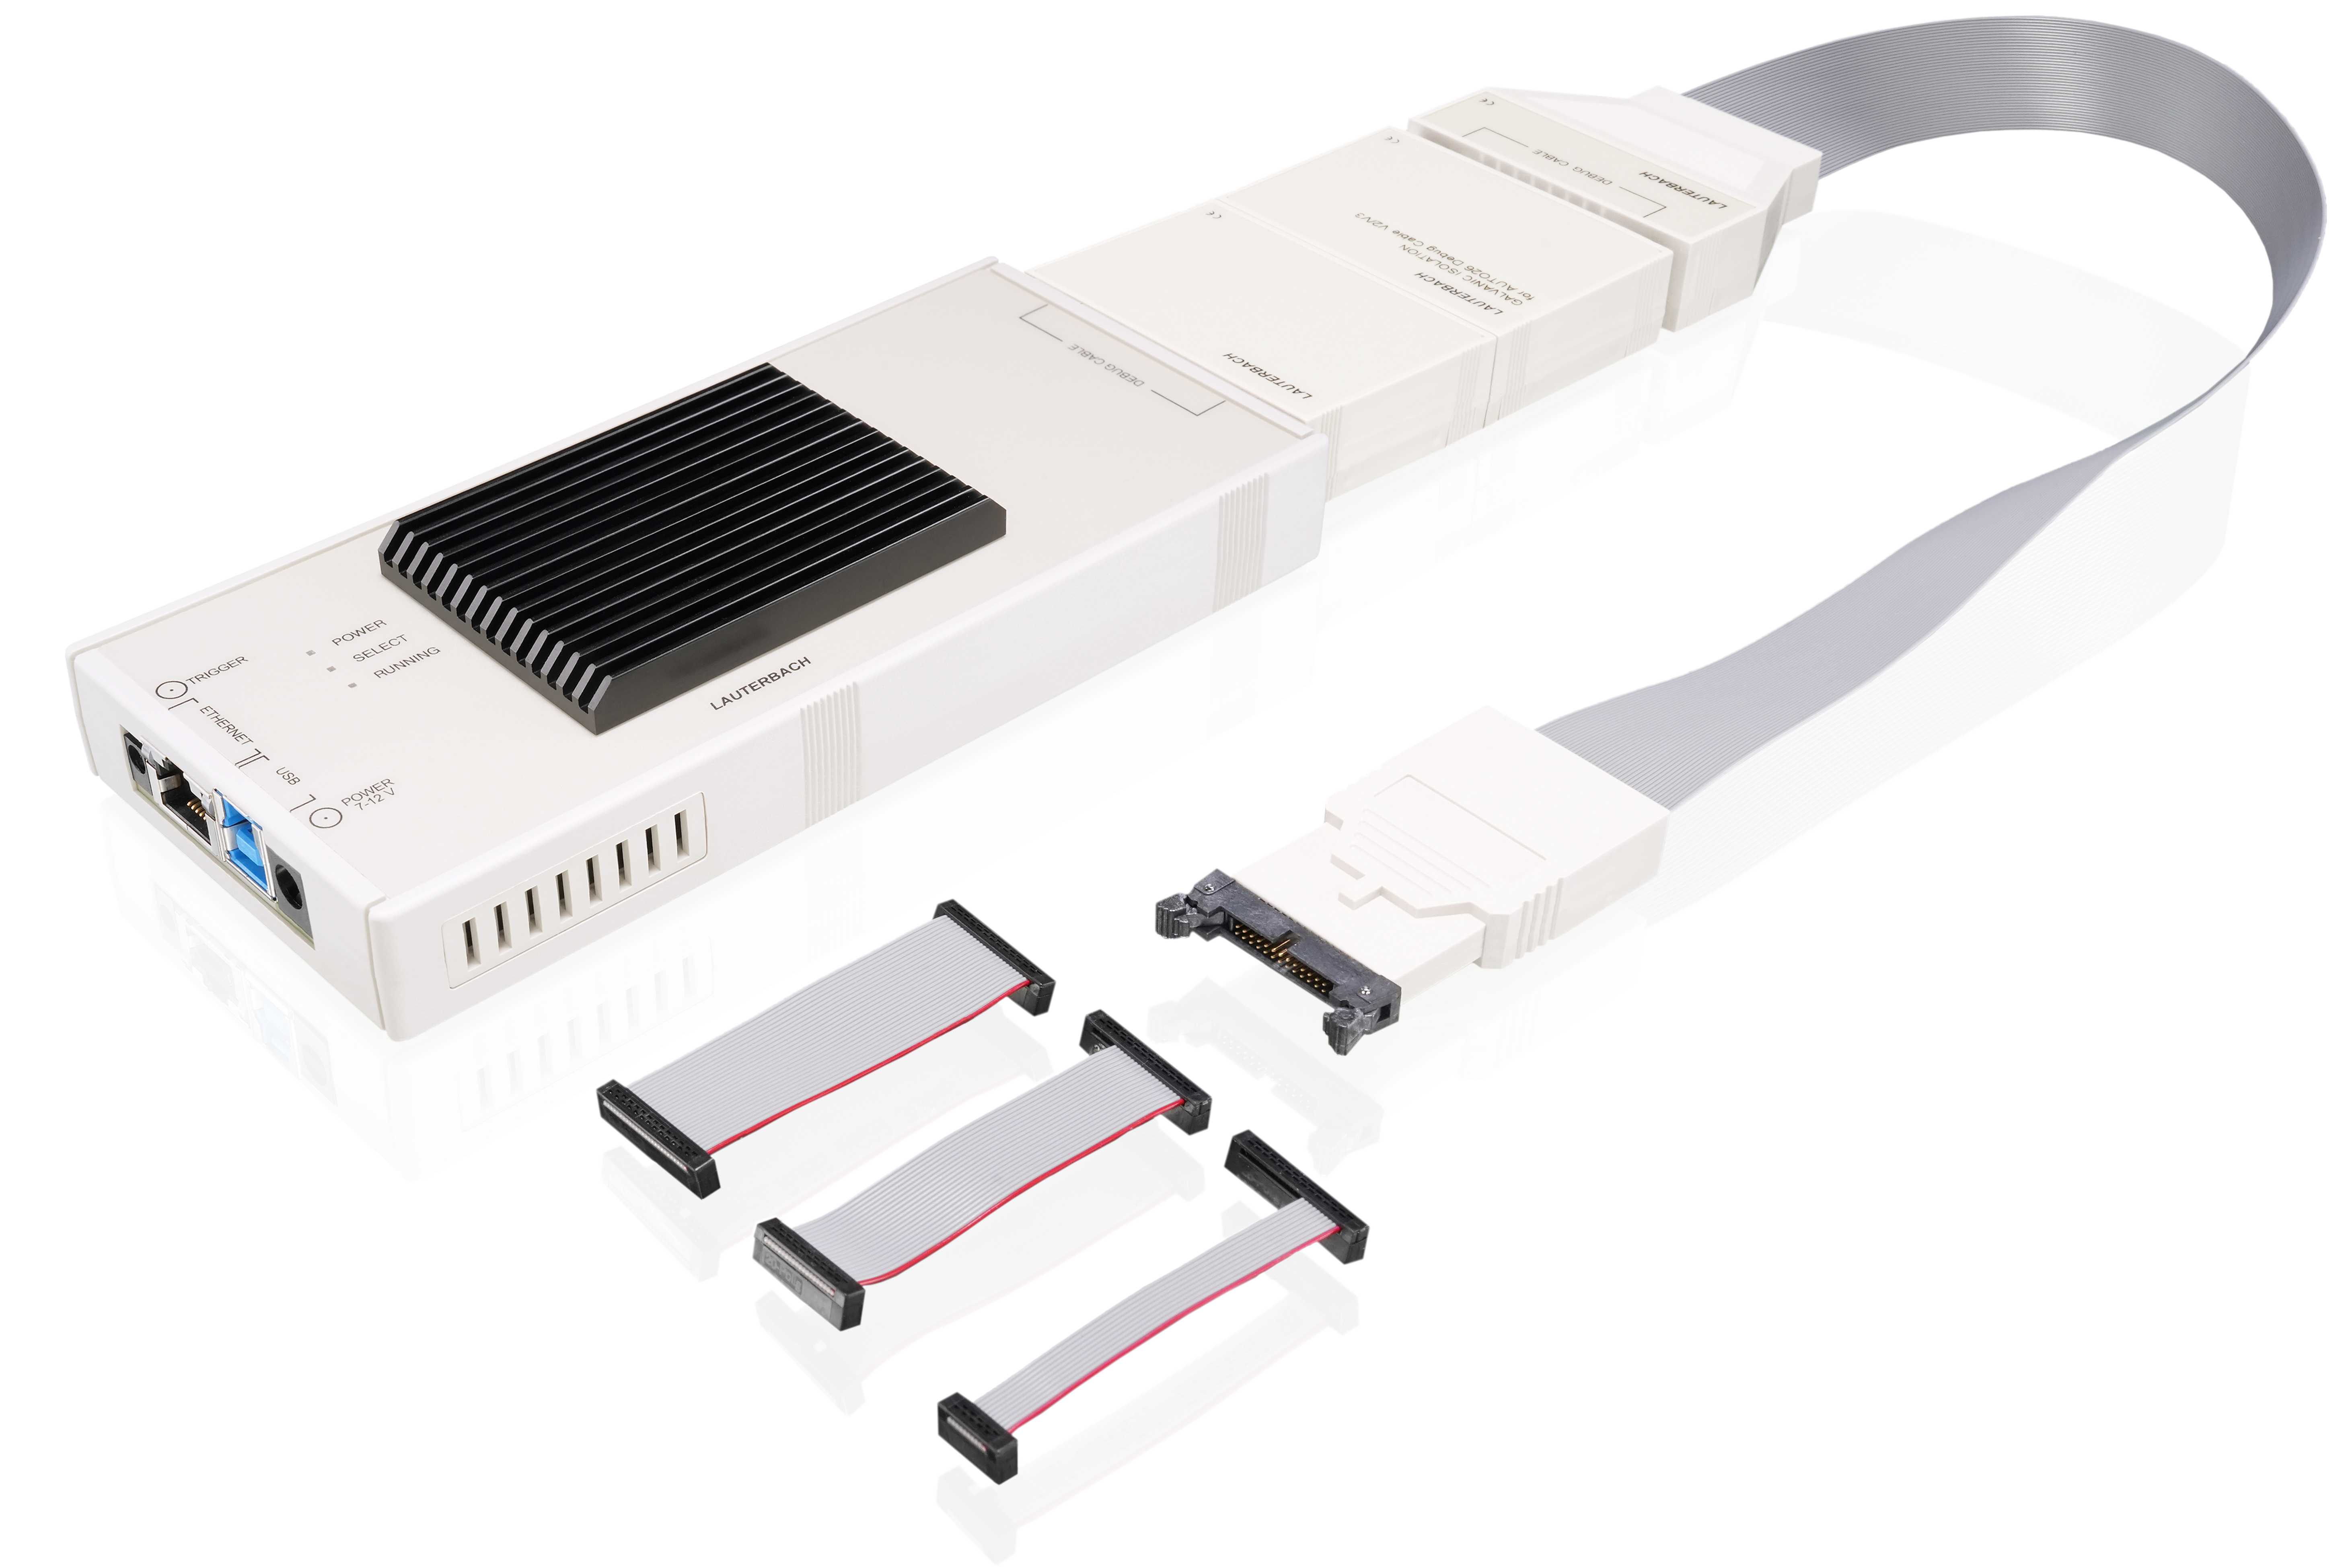
Automotive Debugger Configuration
If your target is based upon a core or SoC designed for automotive applications then this is the perfect configuration for you. The setup is well suited for architectures like TriCore/ AURIX, PowerPC, RH850 and many more. For handling different ground levels, you can add an optional isolation adapter .
Products shown:
- PowerDebug E50
- AUTO26 Debug Probe
- Galvanic Isolation Adapter (optional)
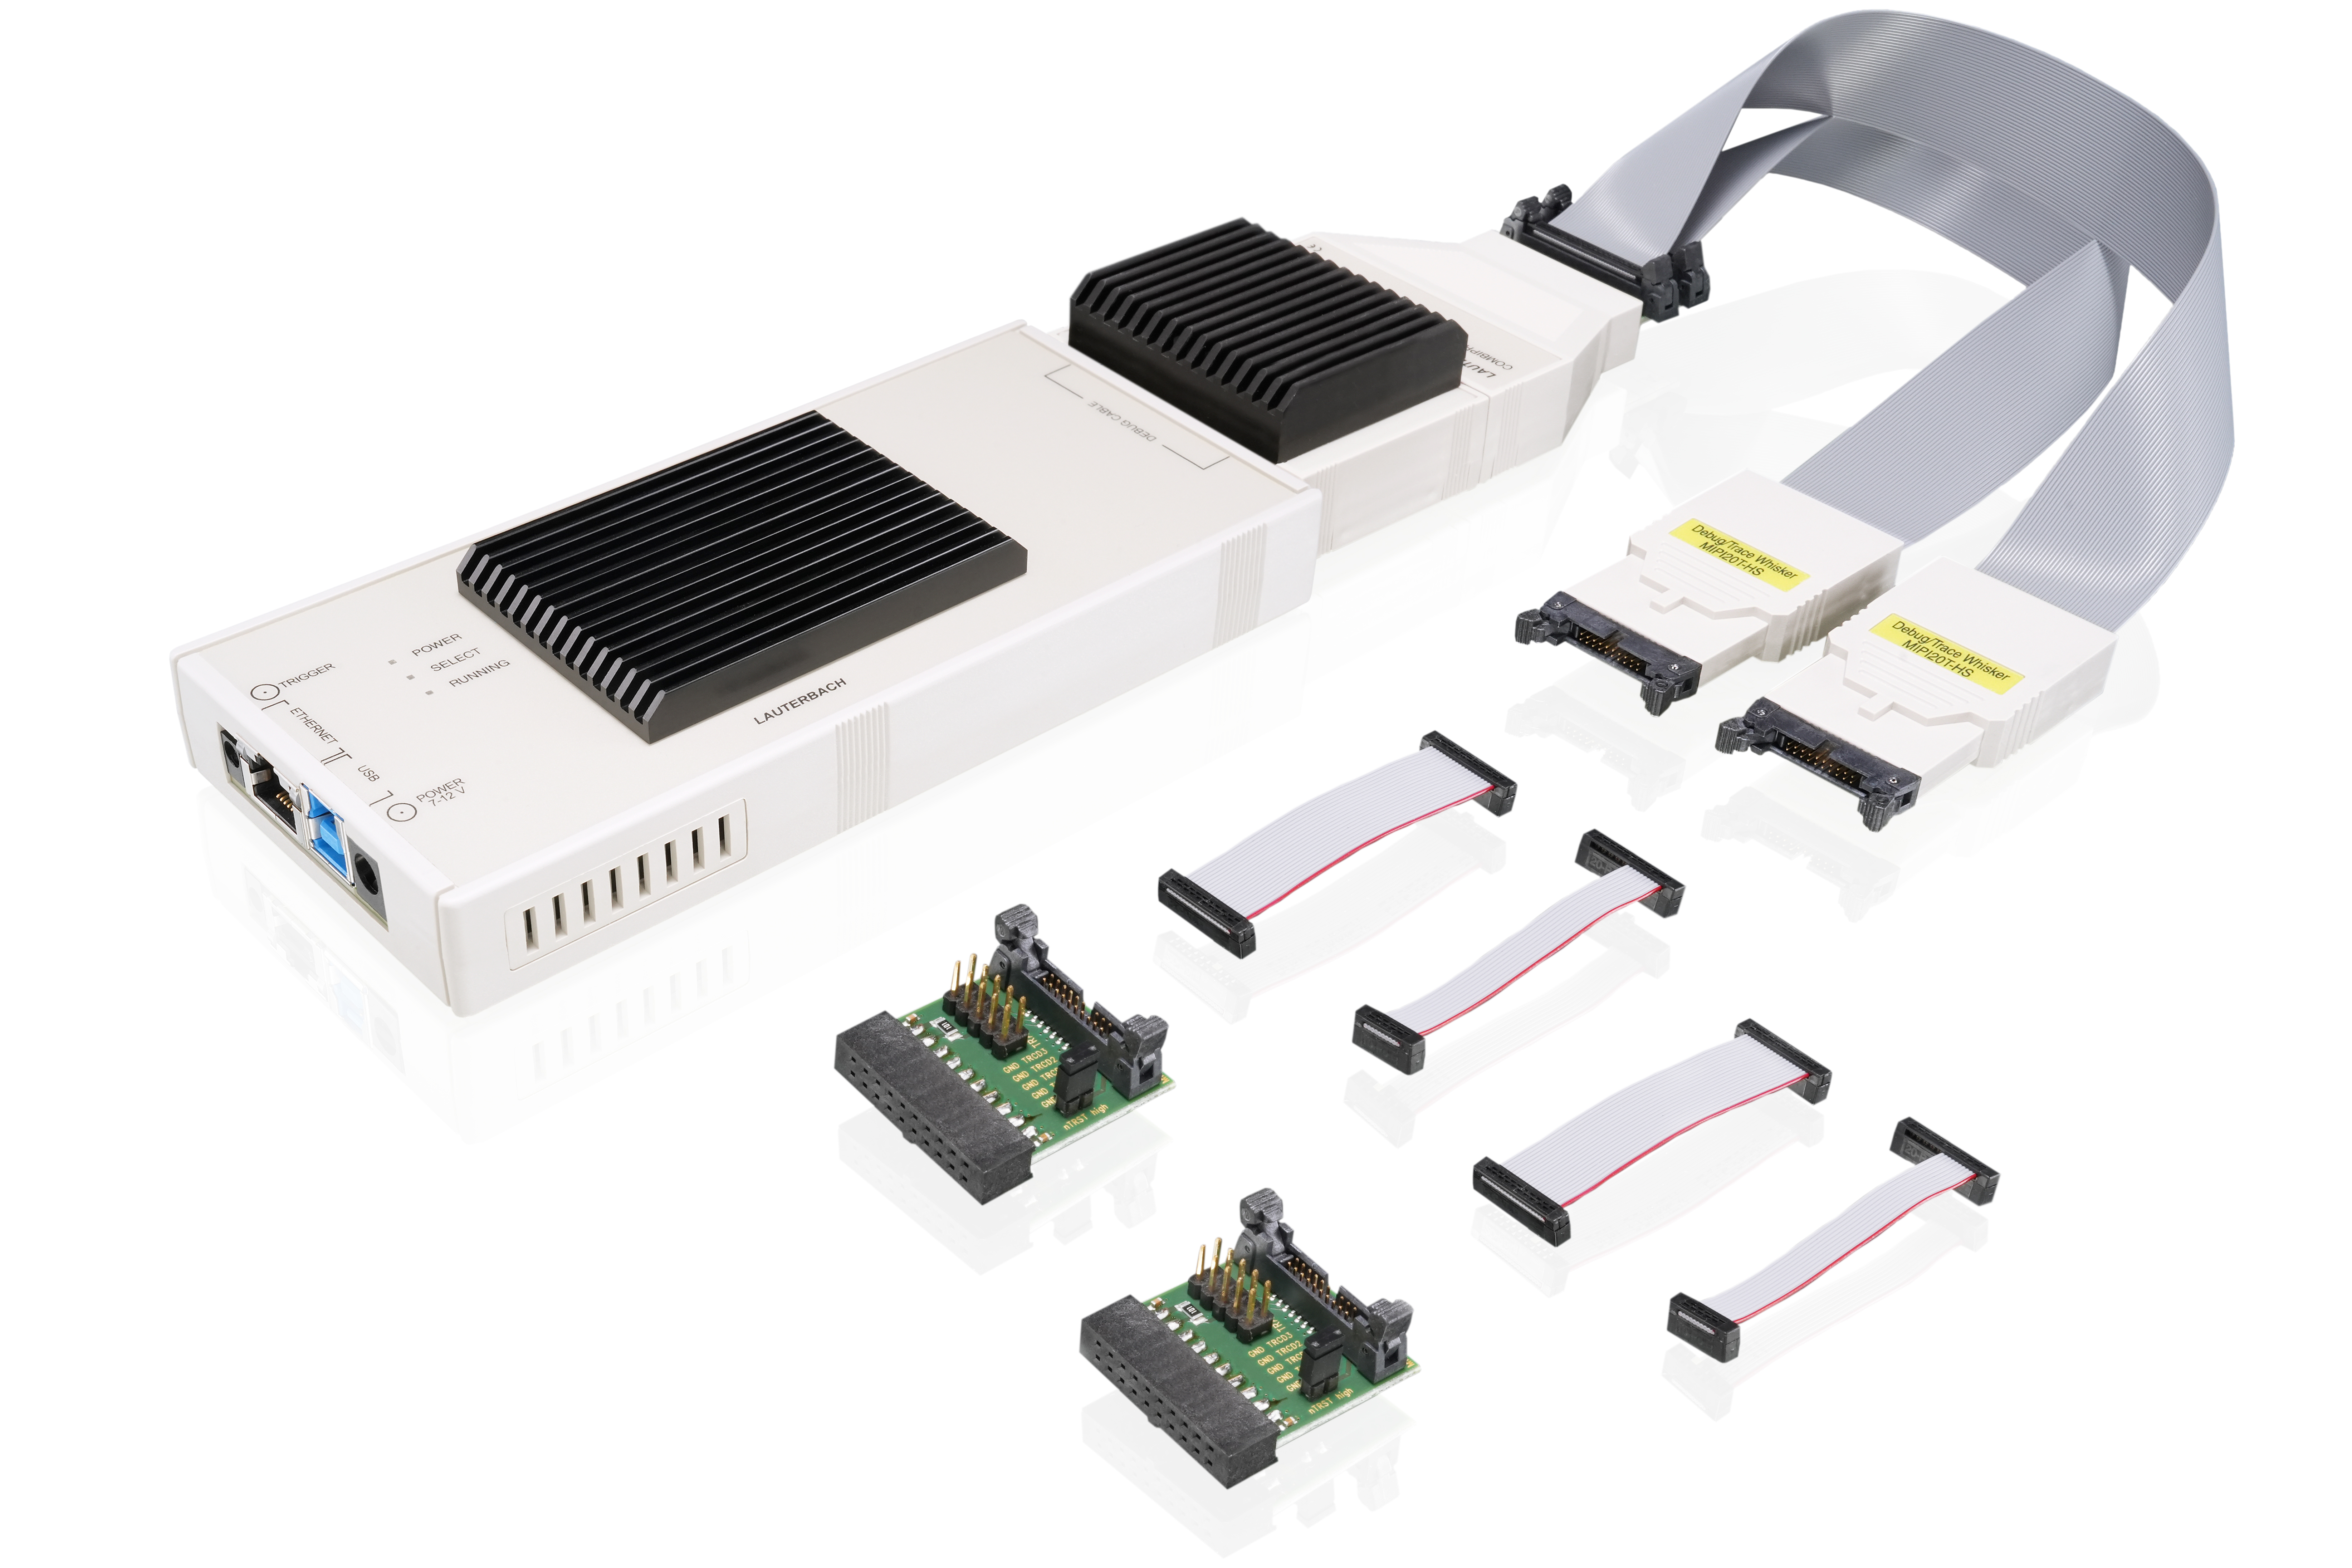
Dual-Chip Arm Cortex-M Tracing
For your safety critical applications you may implement dual- chip configurations based on Arm Cortex- M CPU cores. In this case you often want to trace the program flow of both Cortex- M cores concurrently. This configuration supports two independent debug- and trace- ports and can correlate the two 4- bit Embedded Trace Macrocell( ETM) streams with each other .
Products shown:
- PowerDebug E50
- CombiProbe 2
- 2 x MIPI20T-HS Whiskers
Compare Debug Base Modules
This product |
|||
 |
|
 |
|
| Product | PowerDebug X51 | PowerDebug E50 | µTrace |
| PC Interface |
USB 3.2 Gen 1, Type C and 2.5 Gigabit Ethernet (included) |
USB 3.2 Gen 1, Type B and optional Gigabit Ethernet |
USB 3.2 Gen 1, Type B |
| Voltage range | From 0.4 to 5.0 V* | From 0.4 to 5.0 V* | 1.2 to 5.0V |
| Debug Protocols | JTAG, cJTAG, SWD, SWO, DAP and many more | JTAG, cJTAG, SWD, SWO, DAP and many more | JTAG, cJTAG, SWD, SWO |
| Extension connectors | PodBus and PodBus Express | None | None |
| Possible trace extensions | CombiProbe 2, PowerTrace III, and PowerTrace Serial | CombiProbe 2 | Integrated 4-bit trace support (no extensions required). |
| Possible logical analyzer extensions |
PowerIntegrator II, Mixed Signal Probe via CombiProbe 2 or PowerTrace III | Mixed Signal Probe via CombiProbe 2 | Mixed-Signal Probe |
| Trigger Connector | Out 4.4V / In 3.3V (5V tolerant) | Out 4.4V / In 3.3V (5V tolerant) | Out 3.3V / In 3.3V (5V tolerant) |
| Supported Architectures* | Over 150 microprocessor architectures | Over 150 microprocessor architectures | Arm Cortex-M or RISC V 32 bit |
| Host Powered | optionally via USB-C to C cable | N/A | N/A |
| Remote Access to target serial ports | via USB-C | N/A | N/A |
| Stand alone mode | via µSD-Card, Start-Button, User LEDs | N/A | N/A |
| Clock Sync. with other PowerDebug | via PodBus | N/A | N/A |
| See more | See more |
*: Depends on the debug probe used.
Request a Price Quotation

Universal debug base module of the Essential Line (Gen 5) with 1 Gbit Ethernet (optionally) and USB 3.x Gen 1 for Windows/Linux/macOS. Requires license LA-3544X for direct Ethernet access (via TCP/IPv4 and TCP/IPv6). Requires a TRACE32 Debug Probe (Debug Cable or CombiProbe). Requires TRACE32 software release R.2022.09-SP2 or newer with USB. Requires TRACE32 software release R.2025.09 or newer with Ethernet. Requires a PC or Mac running Windows, Linux or macOS. If you want to use PodBus extensions, you need a PowerDebug X51 (LA-3507) instead.