Debugging over USB

Full Debug and Trace Experience via USB Connection
In some applications you have to debug and trace targets without physical access to the Debug/Trace interfaces, e.g. if the target is located in a closed chassis. TRACE32 ® supports several silicon IP solutions that enable full debug and trace functionality without limitations by using a USB connection between the target and your (host) computer. These solutions provide low-level access to the target without requiring physical access to Debug/Trace interfaces.
Tessent Embedded Analytics
The Tessent Embedded Analytics Ecosystem provides several analytic modules for debug and trace. The communication is based on messages which are routed by a message engine. The Communicators allow to transmit their message via various physical interfaces - one of them is USB.
Features
- Full support for all IP blocks needed for debugging and tracing
- Stop-mode debugging via USB stack
- Multi-core debugging of identical cores and cores of different architectures
- OS-aware debugging including Linux
- Core trace and bus monitoring via USB stack

Intel Direct Connect Interface (DCI) DbC
Intel DCI DbC allows to debug Intel x86-Platforms via the USB port. The communication infrastructure is based on JTAG. The central component is the DCI bridge which generates JTAG scans based on the commands coming in via USB. These JTAG sequences allow you to access the internal Test Access Port (TAP) of the chip as well as externally connected JTAG devices (e.g., the CPU of a client or server system).
Features
- Stop-mode debugging via USB stack
- Multi-core debugging of identical cores (including hyperthreading) and cores of different architectures
- BIOS/UEFI debugging with tailor-made GUI for all UEFI phases
- Linux- and Windows-aware debugging

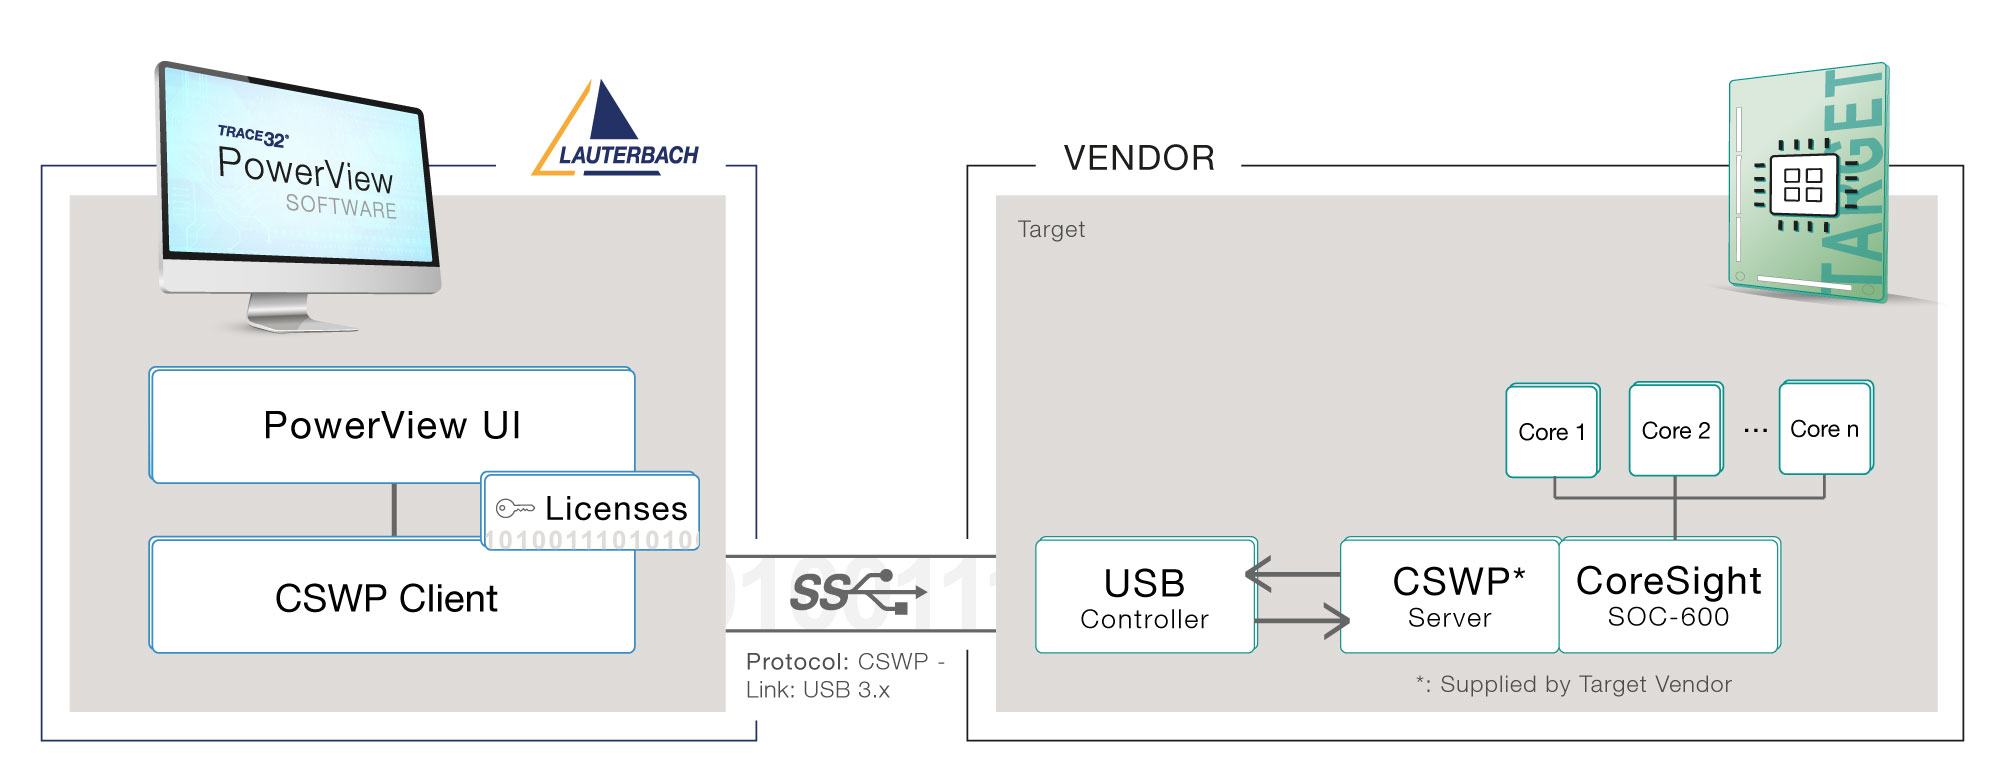
Arm CoreSight Wire Protocol (CSWP)
The Arm CSWP protocol is a standardized transport protocol, which is agnostic of the physical link. By implementing Arms CoreSight SoC-600 IP the SoC can leverage access standards to debug memory space and an enhanced embedded trace router (ETR) that supports high-bandwidth streaming trace mode. Communication between the SoC and PowerView is controlled by a CSWP server implemented on the chip.
Features
- Full support for all IP blocks needed for debugging and tracing
- Stop-mode debugging via USB stack
- Multi-core debugging of identical cores and cores of different architectures
- OS-aware debugging including Linux
- Core trace via USB stack
Typical TRACE32 Configurations

Tessent Embedded Analytics for 64-bit RISC-V
Debug & Trace your SoC that is equipped with the USB Communicator of the Tessent Embedded Analytics IP.
Intel DCI DbC for Intel x86 Architecture
Debug & Trace your SoC that is equipped with the Intel Direct Connect Interface (DCI).