C7000 Debugger & Trace
C7000 DSP Cores as Part of Complex Arm SoCs
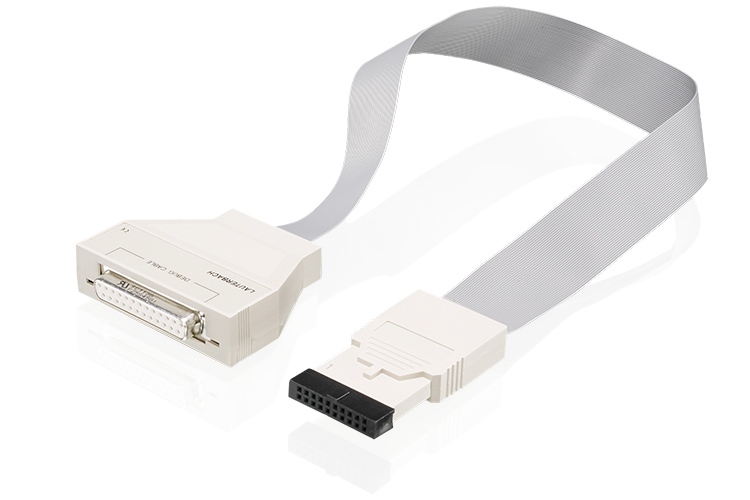
Benefit from Lauterbach’s leading edge development tools to analyze any complex SoC integrating Arm Cortex-A-, Arm Cortex-R- and C6x cores with C7x DSP cores. C7000 DSP cores are a popular choice for deep learning processing in automotive (ADAS) as well as industrial control and avionics. Using our TRACE32® tools you can debug and control any C7000 core (along with all of the other cores) in your SoC via a single JTAG debug interface, all at the same time. TRACE32® tools support on-Chip and parallel real-time off-chip tracing via Arm’s CoreSight IP.
Supported Sub-Architectures
C71x
Highest Performance and Richest Feature Set
Explore and utilize all the powerful and well-known features of your C7000 cores with Lauterbach debug modules at the highest performance in the industry: full on-chip breakpoint support; run-time memory access and benchmark counters. And of course, everything is scriptable, enabling you to repeat the same test-sequence over and over.
Learn more about our debug systemCapture Your Core’s Actions
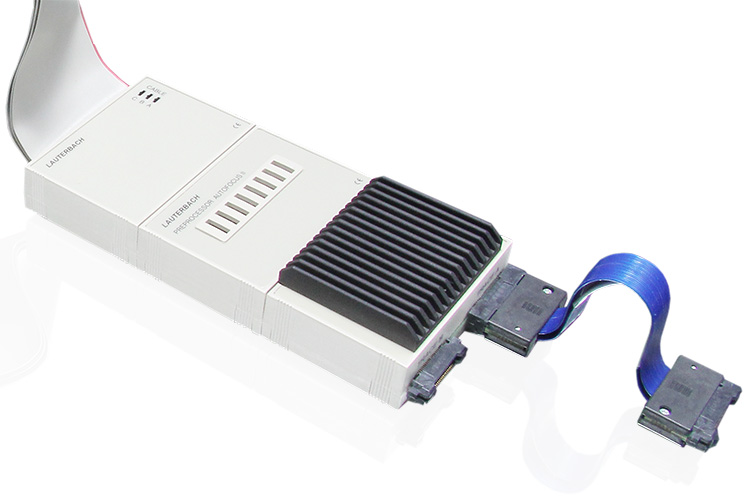
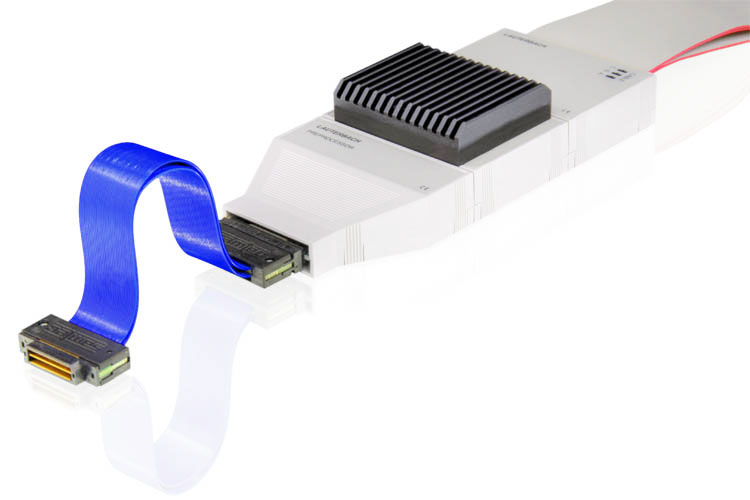
Stop mode debugging can be a powerful tool but tracing is even better. Our trace solutions for C7000 support both on-chip trace and the much more powerful off-chip Trace, which can save the trace-data inside the target memory or emit it to one of our PowerTrace tools. For extended tracing, off-chip trace provides large volumes of trace data and the capability of recording for minutes, hours, or days using trace streaming.
Learn more about our trace system
3rd Party Tools Supported for C7000
The following features are available for all architectures supported by TRACE32. Please contact us if your device or tool is not listed here; support is often already on its way.
Host OS
Our debug software runs on all major operating systems.
Flash Devices
We support the programming of a large variety of flash devices. NOR, NAND, SPI, QSPI, EMMC and more.
3rd Party Integrations
Integrations allow you to easily use TRACE32 with other tools.


