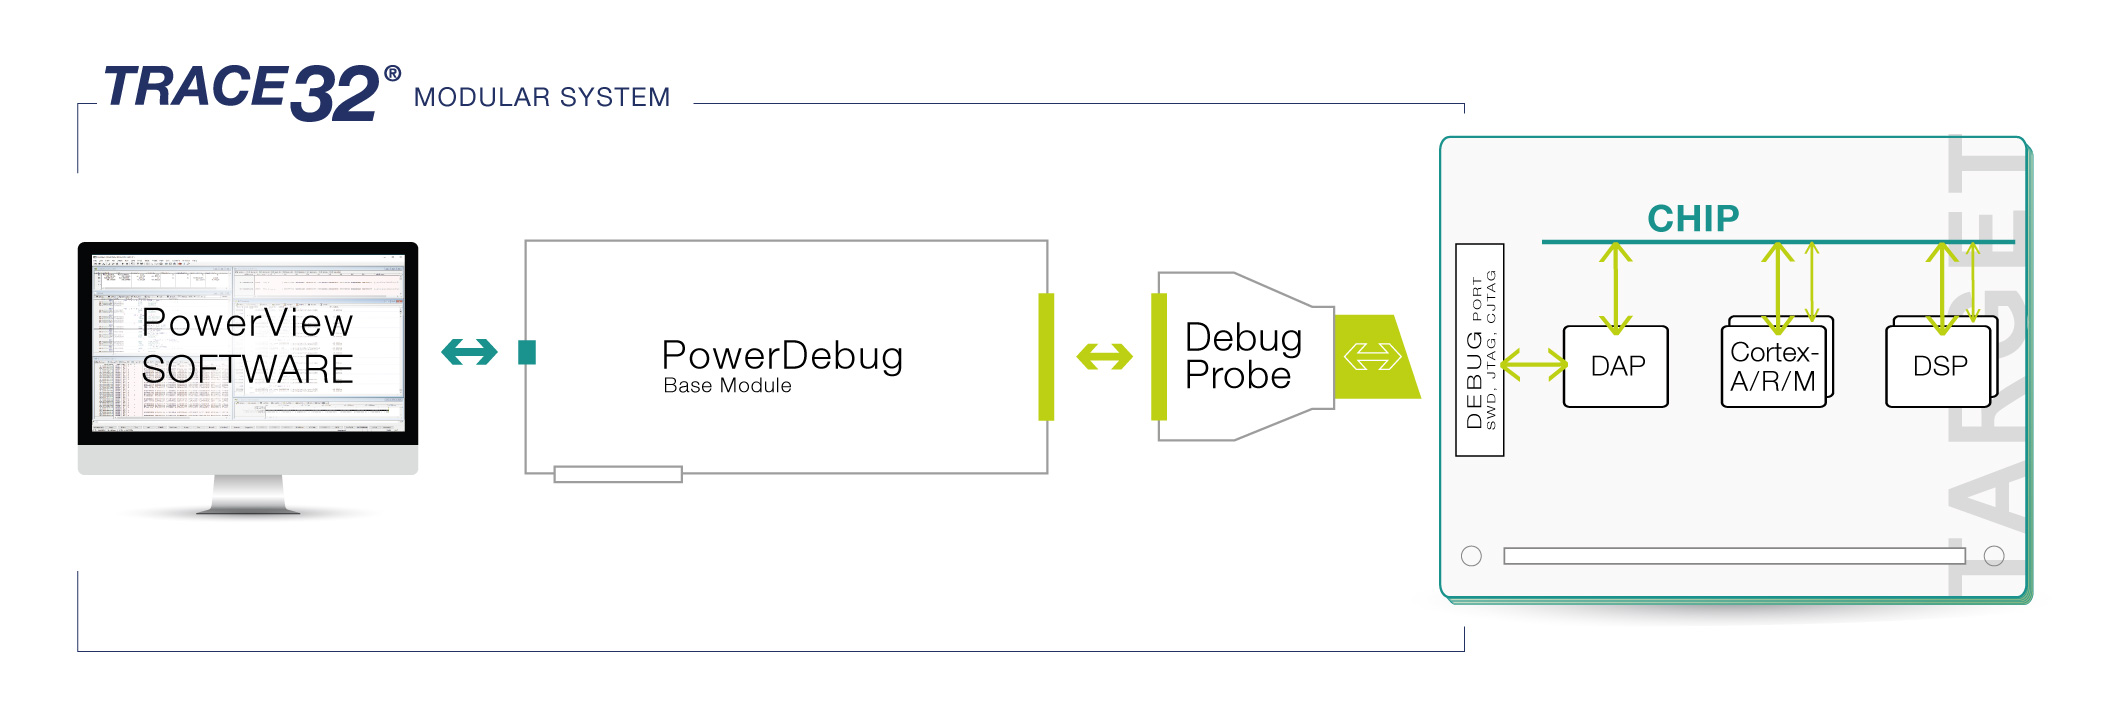
Arm® Debugger & Trace
Total Arm® Debug and Trace
Arm® IP is used worldwide in almost every conceivable embedded design. The RISC based instruction set lends itself to low power, low heat generation, and lower silicon costs than traditional architectures, making them ideally suited for mobile or battery powered applications. Featuring comprehensive debug cores, high speed trace interfaces, numerous interconnects, and design flexibility, it’s no wonder they have become the de-facto choice for System on Chip (SoC) and System on Module (SoM) designs.
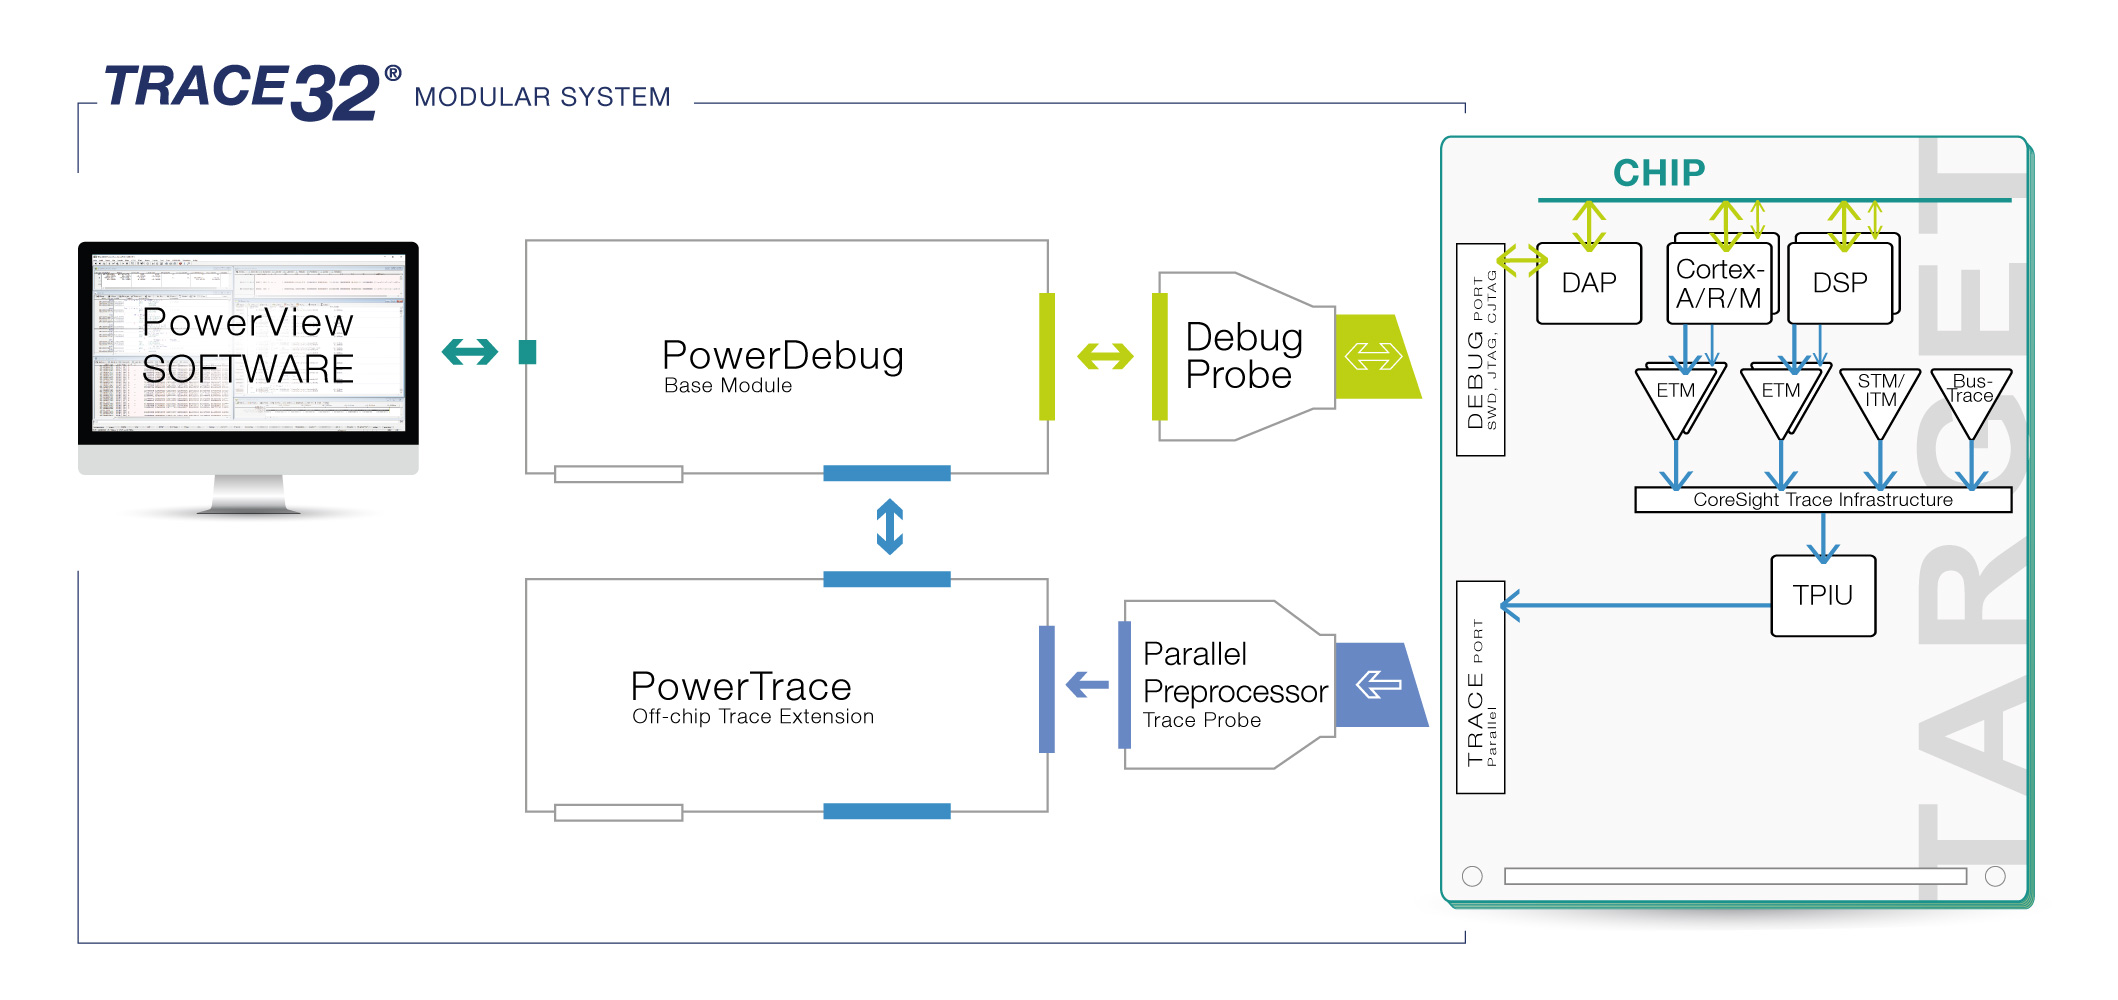
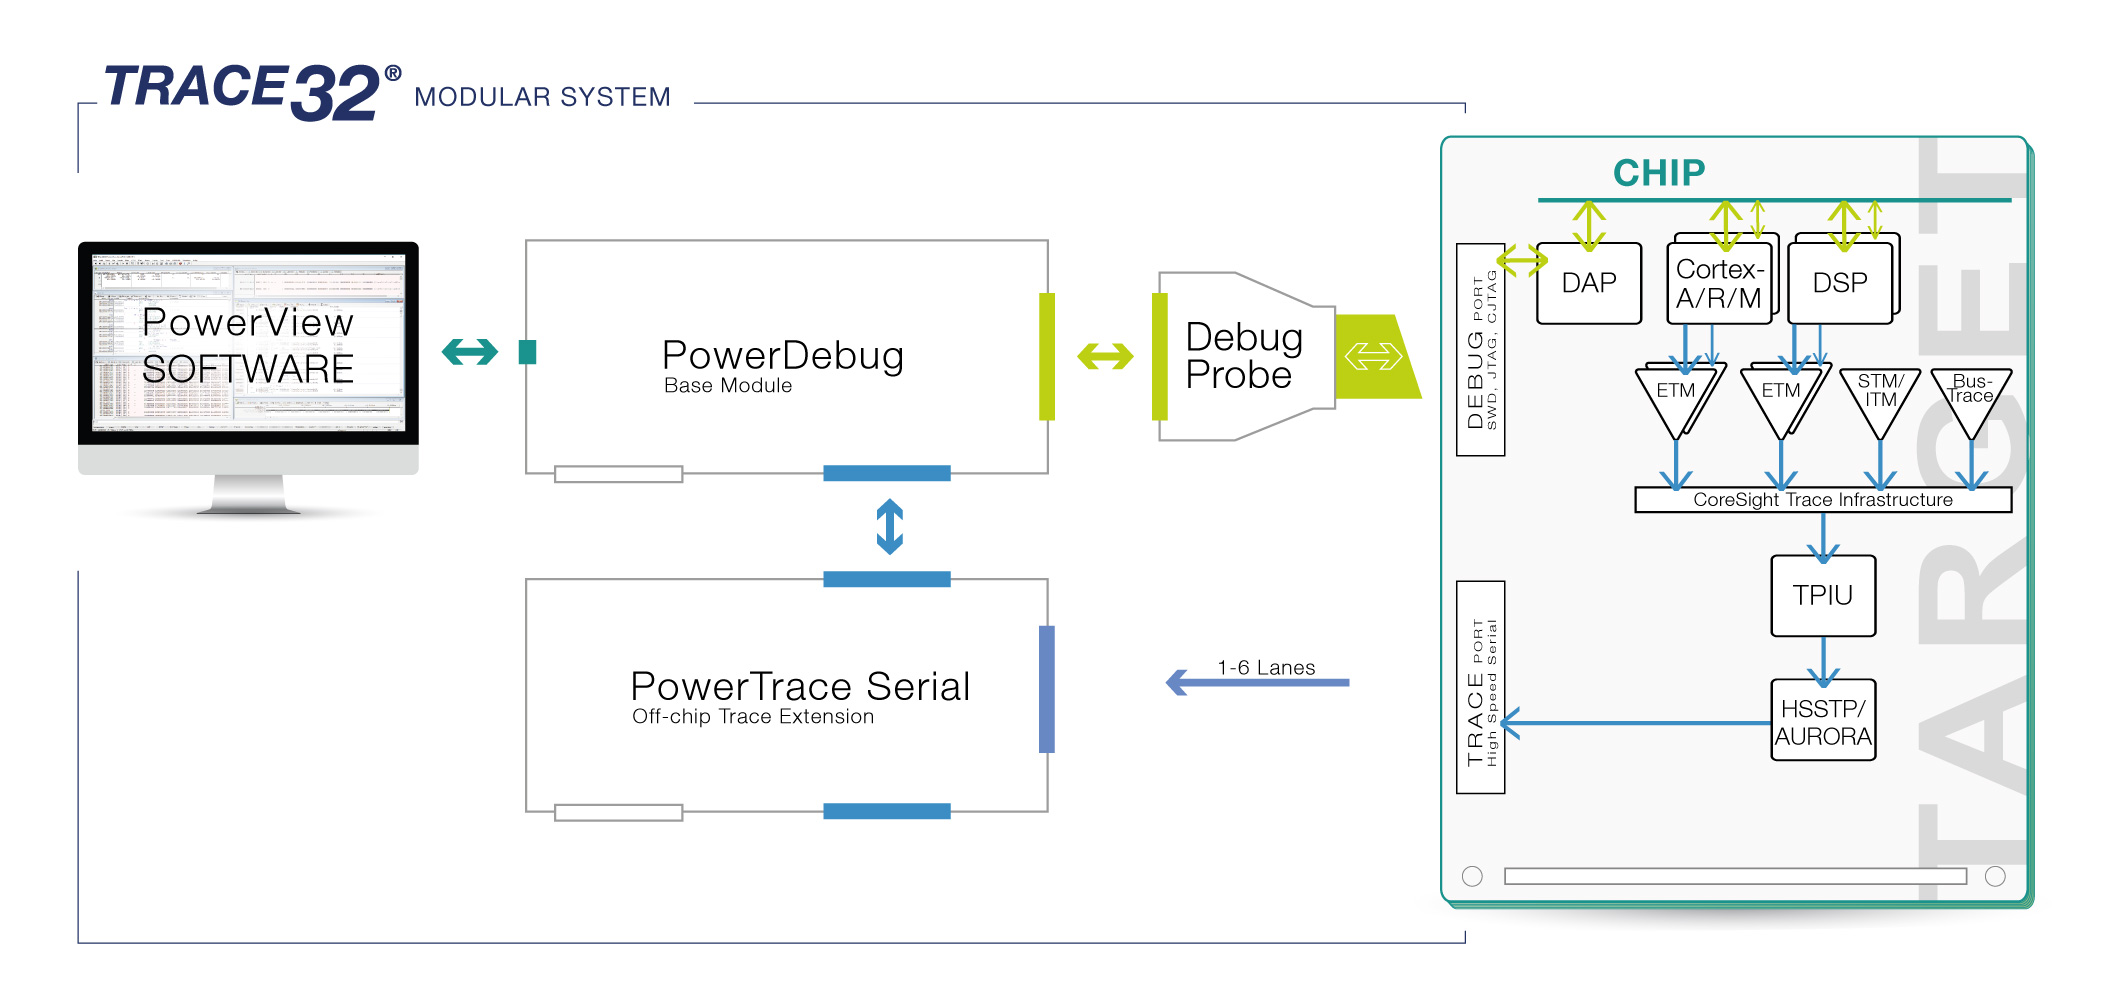
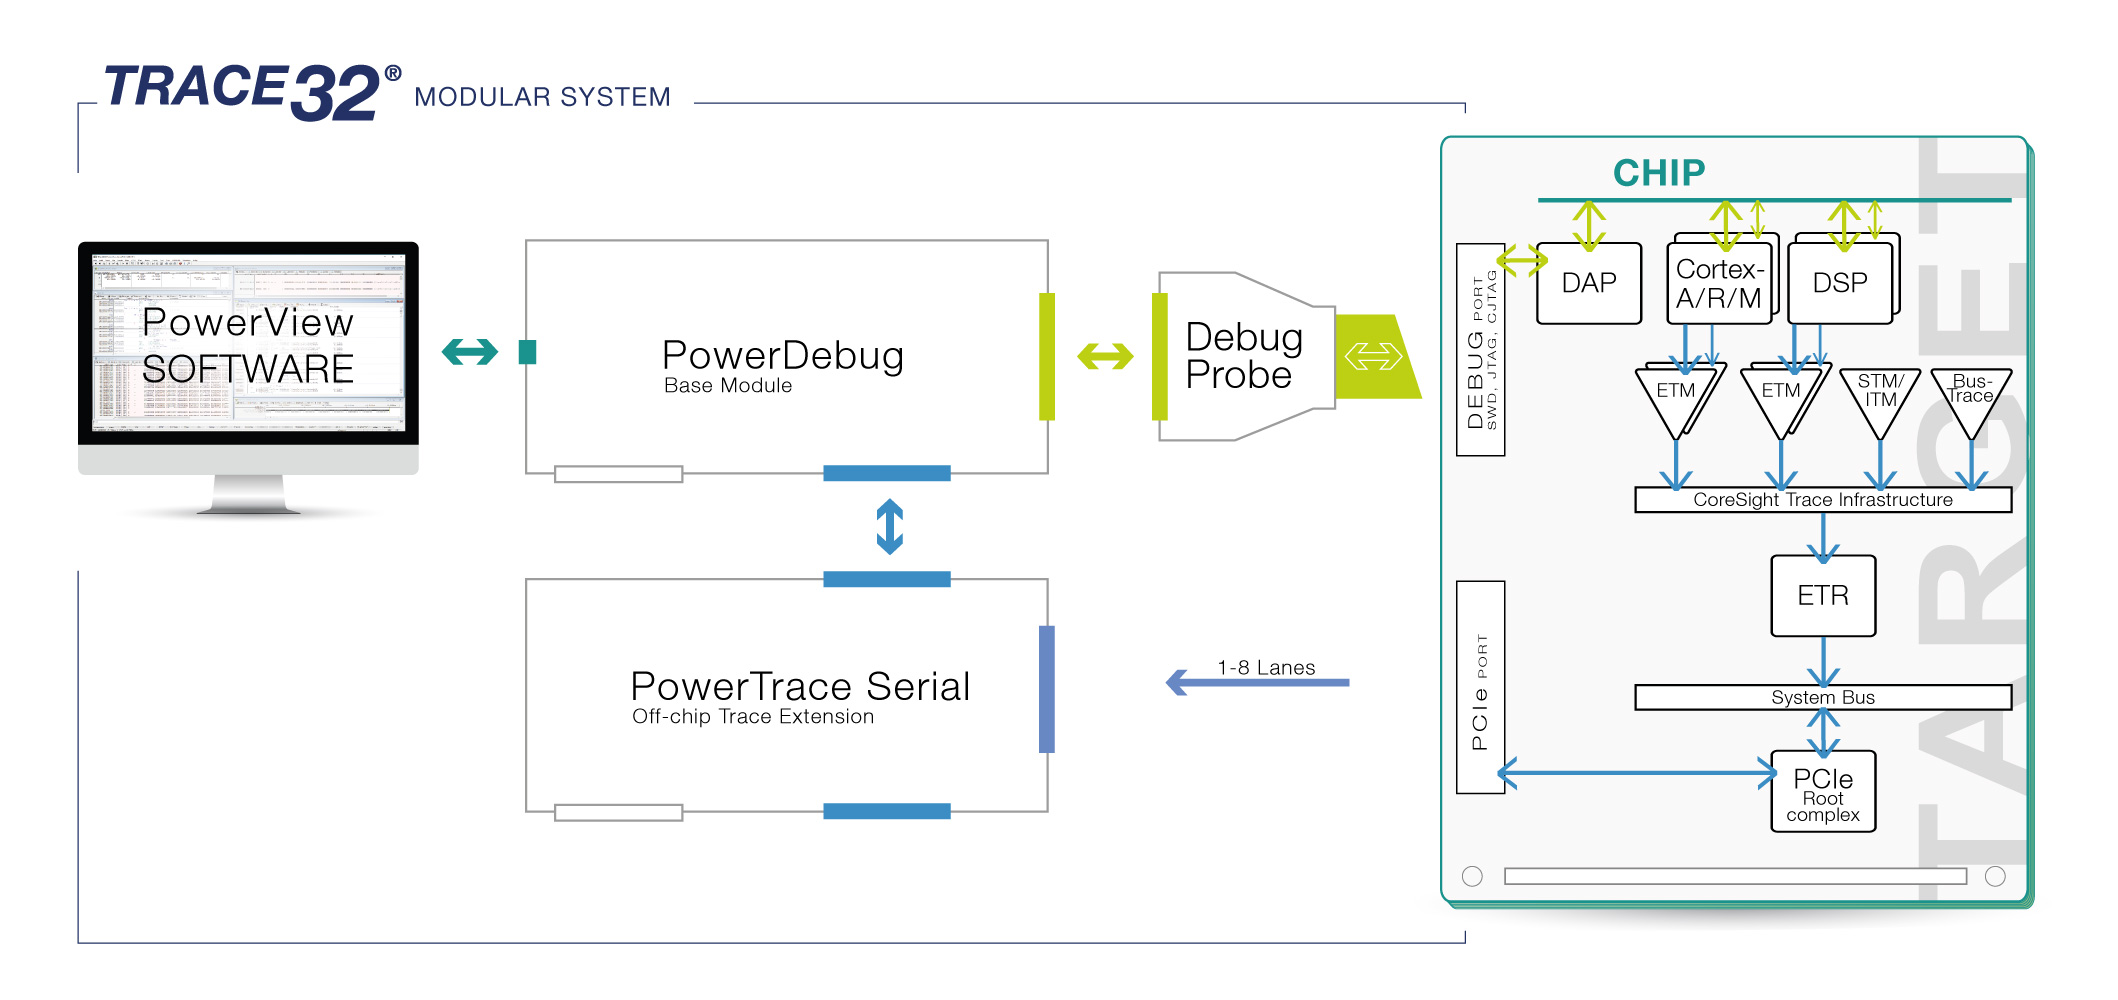
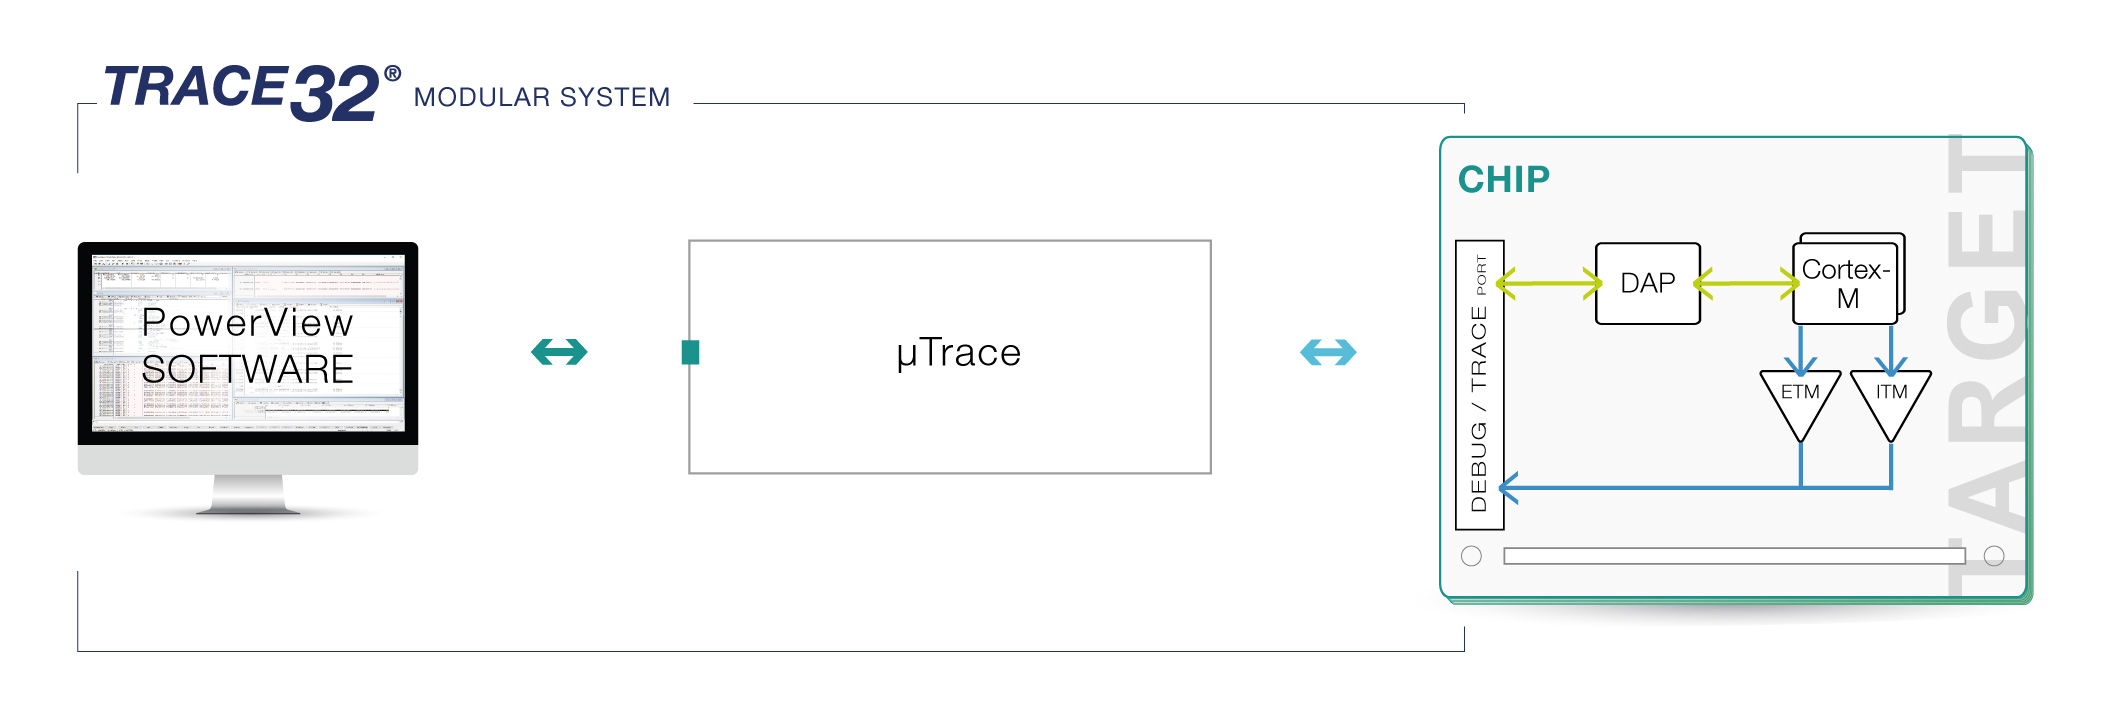
TRACE32 provides a complete suite of tools for Arm®-based micro-processors, from the low cost µTrace for Cortex-M debug and trace, all the way up to the flagship PowerTrace III and PowerTrace Serial family of tools for capturing high speed off-chip parallel TPIU or serial HSSTP trace. All of these provide unparalleled levels of debug capabilities, allowing you to get the best out of your Arm® based embedded design.
Supported Sub-Architectures
Arm®v9/v8/v7/v6, Cortex®-M/R/A/X, C1, ARM7/9/11, SecurCore®, Neoverse™, Kryo™
Understand Your High-Speed SoC in More Detail
Capture the program flow, data accesses, and task switches of multiple cores and other system sources simultaneously in exquisite detail. With the fast bit rate of up to 100 GBit/s and large data buffers, PowerTrace Serial allows you to explore the operation of your device from the top-level module interactions to the timing of individual instructions.
Learn more about our debug systemWhich ARM core do you want to use?
Check out our catalogue of predefined solutions and find the ideal toolset for your project.
Powerful Trace Tools
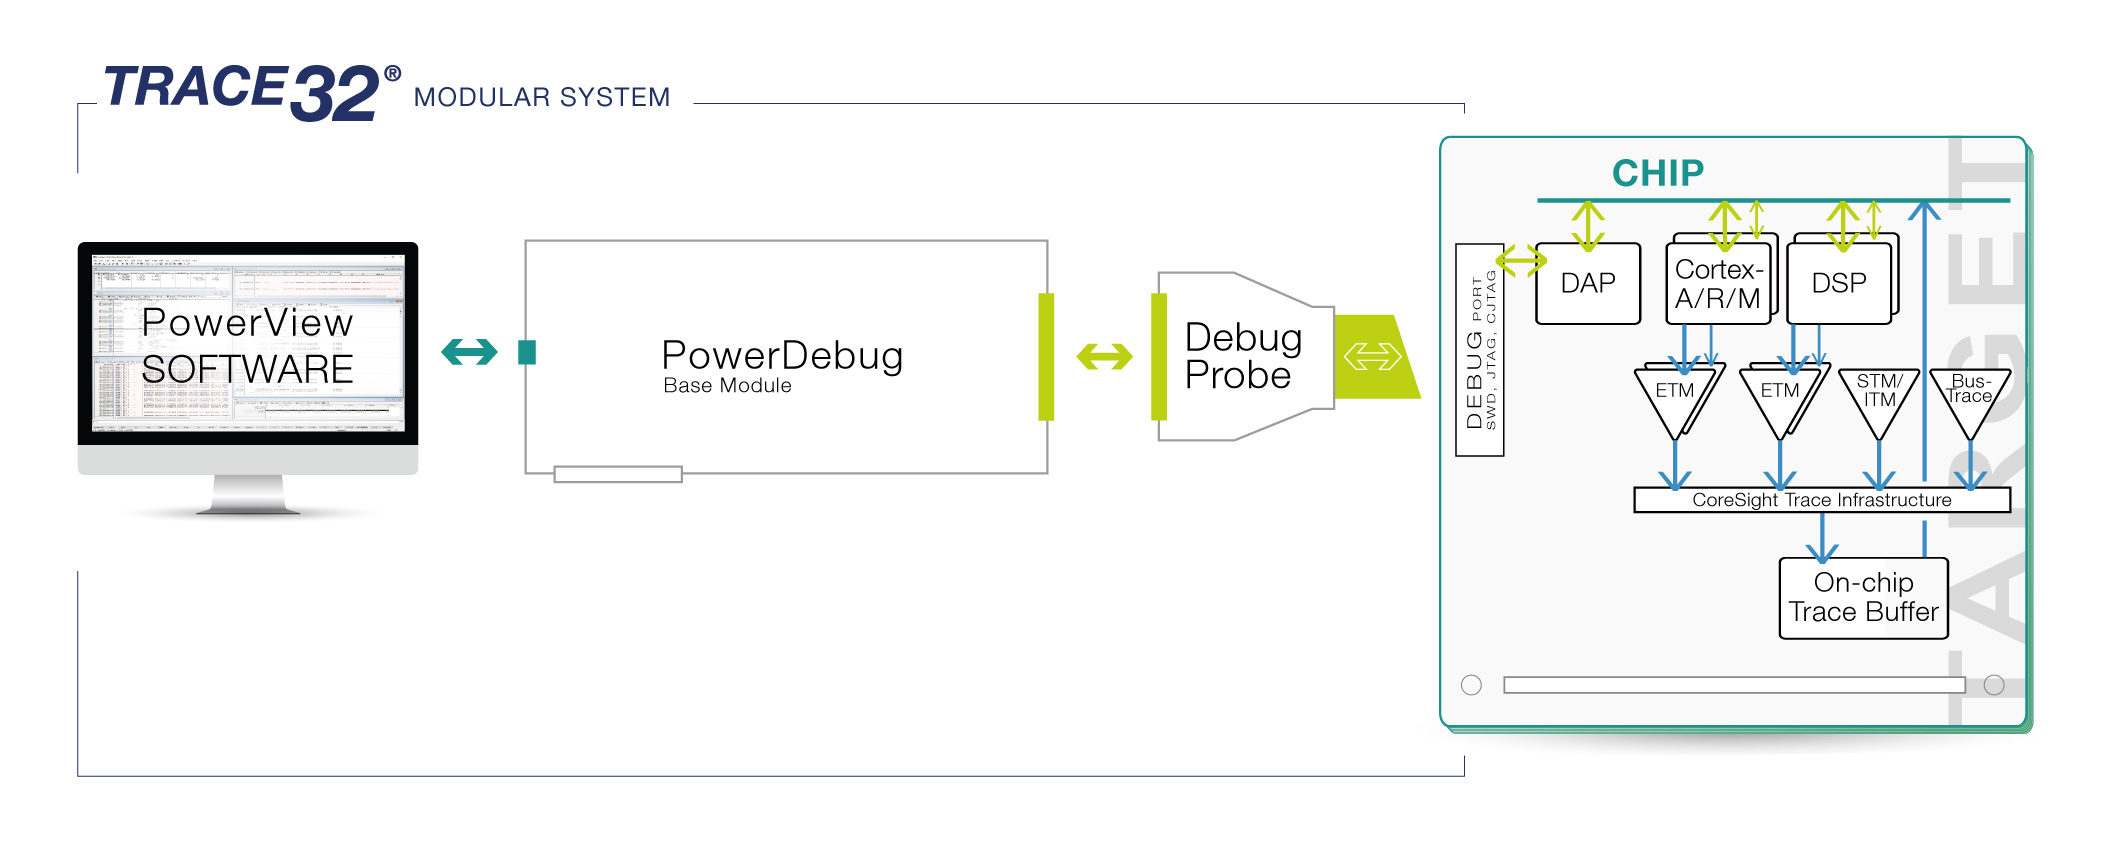
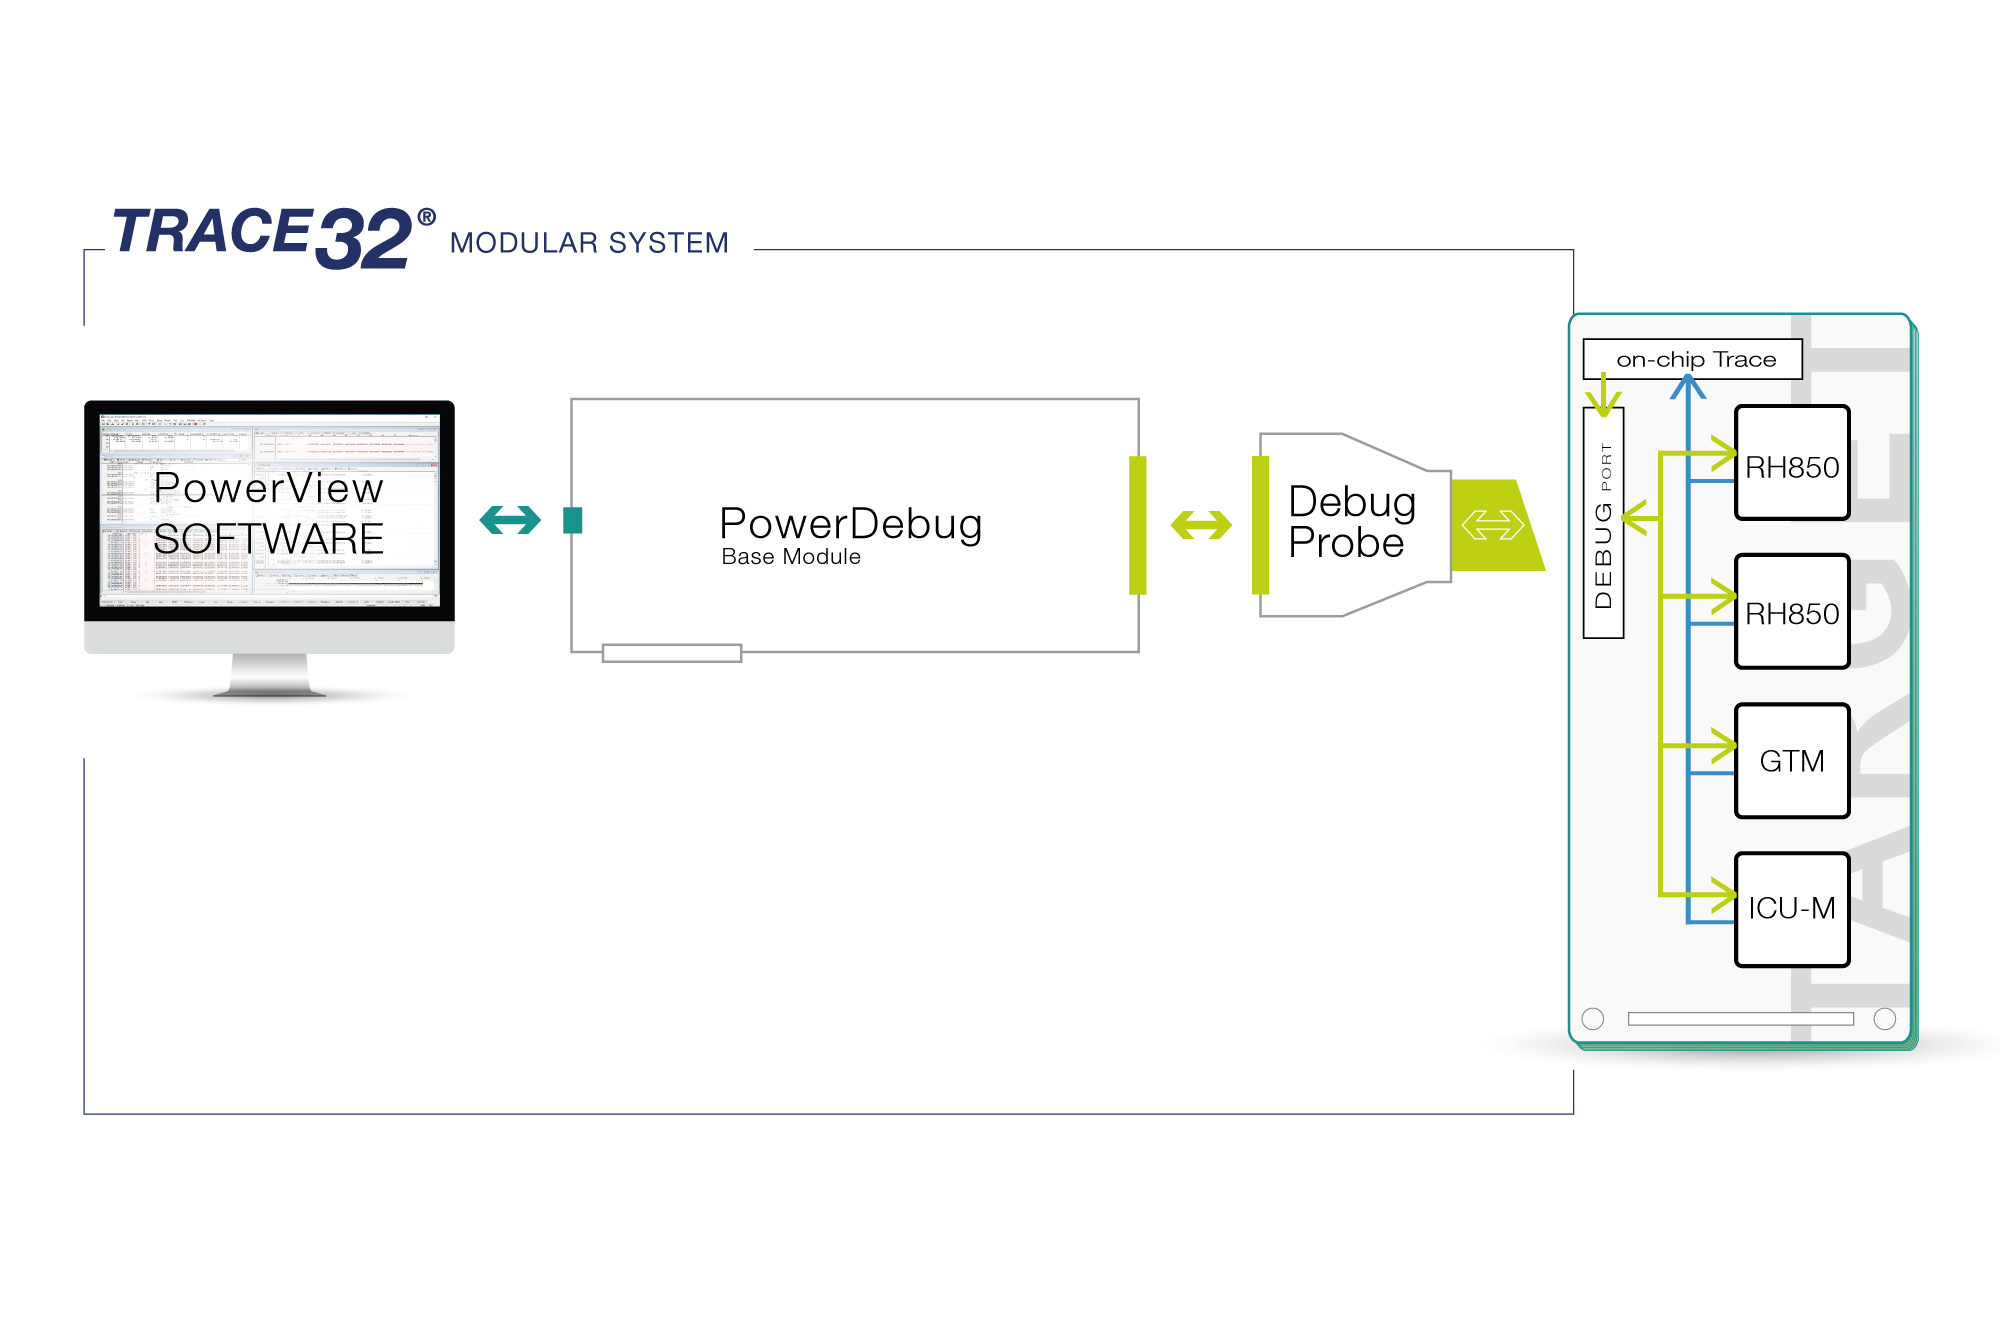
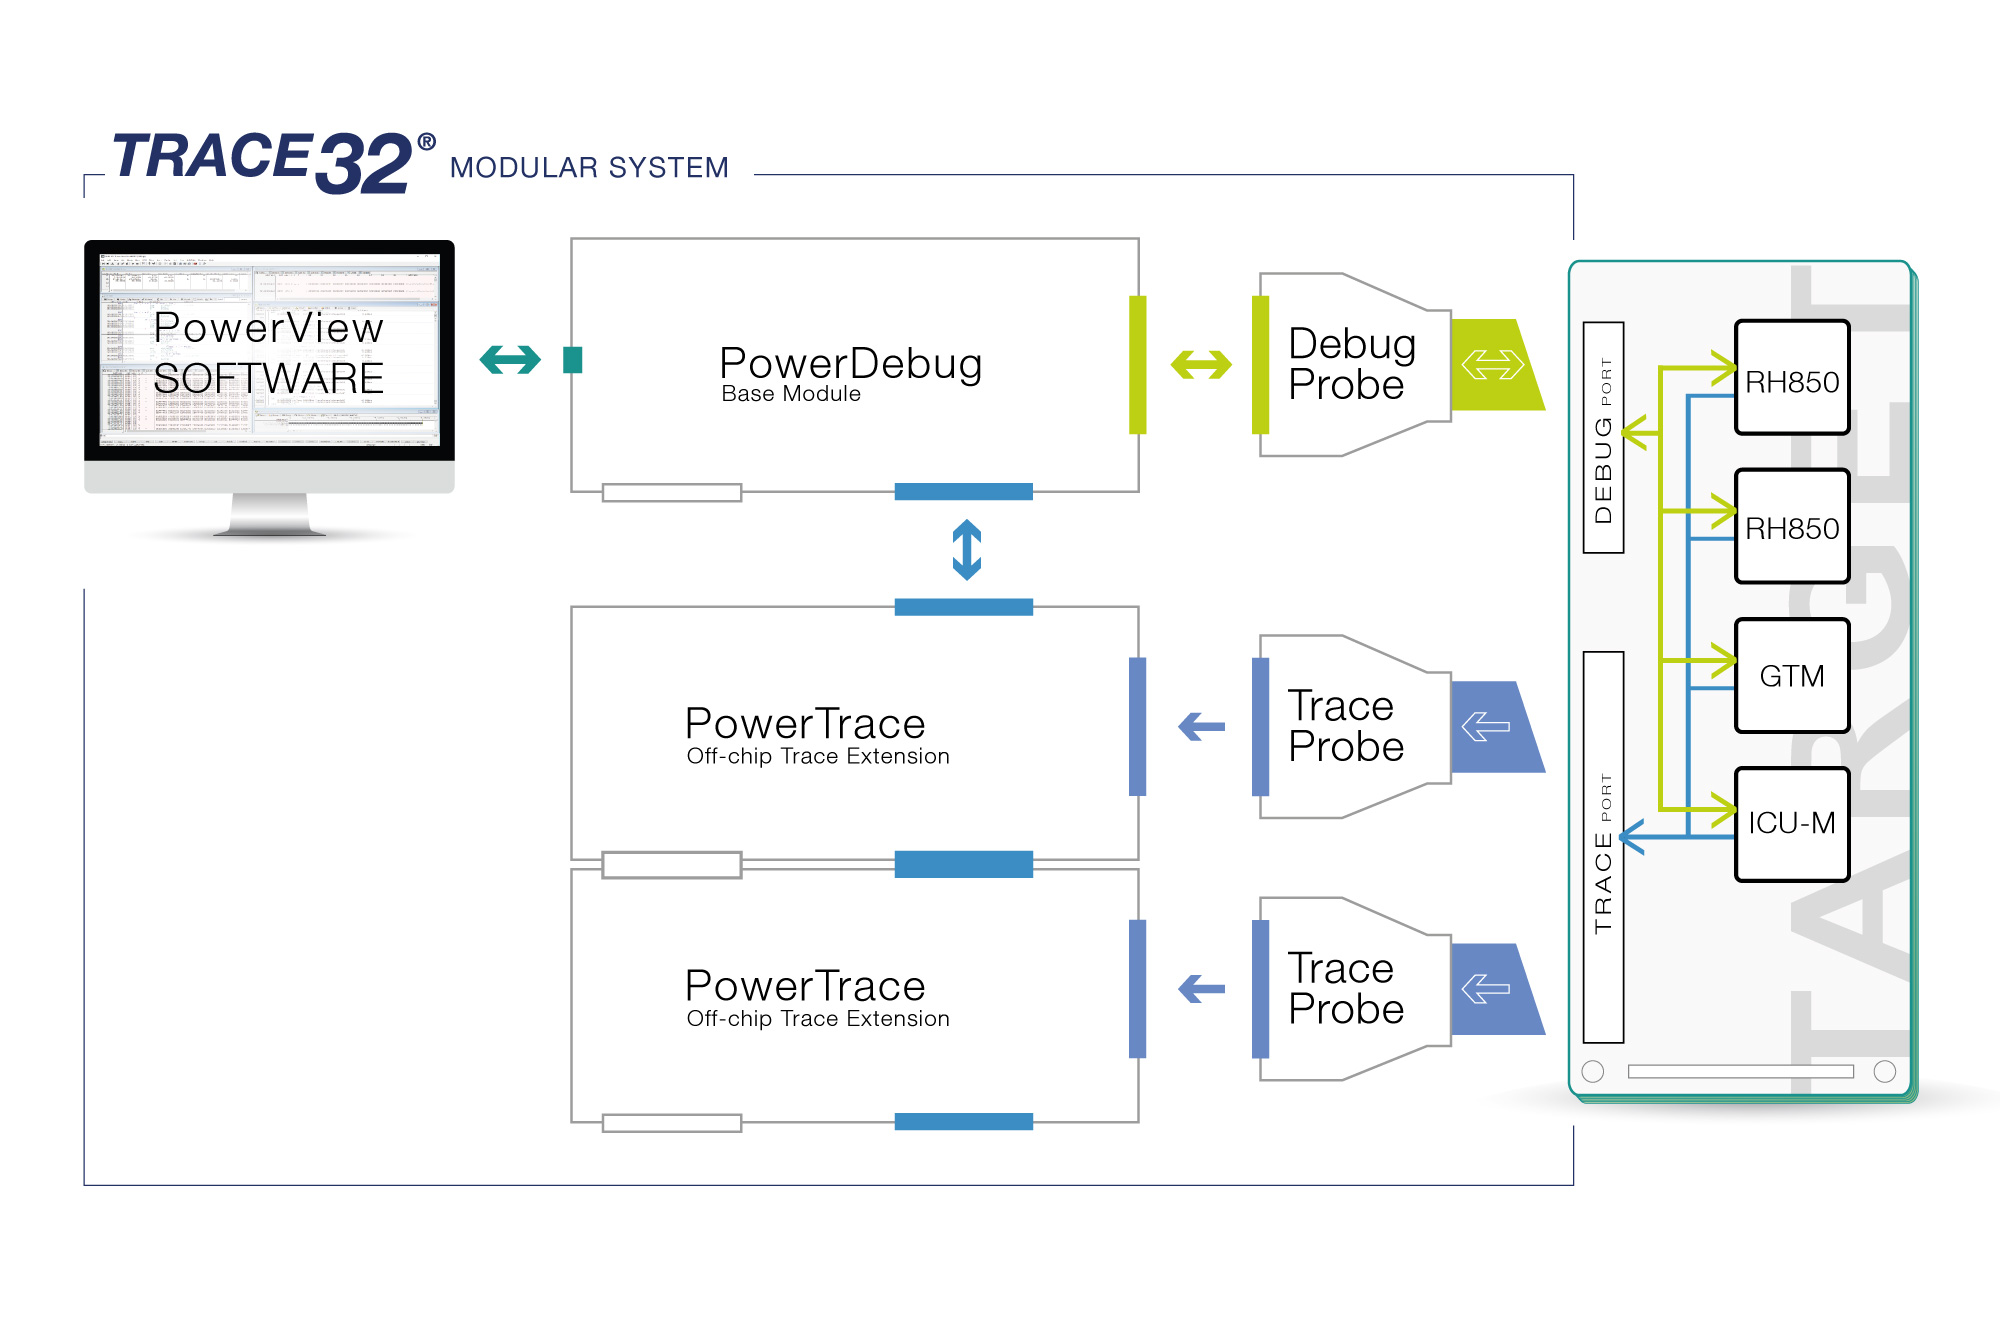
Many Arm® processors include some kind of trace interface, providing program flow and optional data trace can be generated non-intrusively at run-time and either stored in dedicated on-chip memory or spooled off-chip via a trace port, typically TPIU or HSSTP. Options also exist for instrumented trace, allowing you to log only the event that matter to enhance your debug workflow. Many cores that are associated with SoCs are capable of generating trace data and inserting it into the trace stream, effectively allowing all cores to share a physical trace connection. This trace information is timestamped and provides incredible levels of detail for analysis of all aspects of your target system.
µTrace® All-In-One Solution for Arm Cortex-M Cores
Leverage the power of a full debug and trace system that’s geared towards your Arm Cortex-M based embedded design.
Which ARM core do you want to use?
Check out our catalogue of predefined solutions and find the ideal toolset for your project.
Debugging Virtual Targets
Application code and algorithms can be tested and refined using a variety of Arm® based virtual targets. TRACE32 allows you to work on your virtual targets with the same familiar set of tools and user interface as your real-world hardware. This reduces the need for extra training and means you can get up to speed immediately and be productive from day one.
Work with any virtual target that supports the Multi-Core Debug API (MCD) for both debug and trace or GDB for debug. Full support for Arm’s fast models and IRIS interface is provided.
3rd Party Tools Supported for ARM
The following features are available for all architectures supported by TRACE32. Please contact us if your device or tool is not listed here; support is often already on its way.

