Hunting Linux Time-Eaters with
Hardware-Based Tracing
Author(s): R. Dienstbeck, F. Berat - Fa. ADIT
Publishing Date:
27-Nov-2018
Company
Advanced Driver Information Technology GmbH (ADIT)
Location
Hildesheim, Germany
Company Size
67 employees (as of January 2021)
Industry
Automotive
Analyzing runtime behaviour of a target system
The ability to analyze the runtime behavior of a target system can be a very important, but often overlooked, part of the debug process. Often, in a real-time system a late answer is as bad as a wrong answer. Various software tools exist, especially in the Linux world, to help measure the performance of an embedded system but sometimes they just end up compounding the problem. This article shows how Advanced Driver Information Technology GmbH (ADIT) in Hildesheim used Lauterbach’s TRACE32, a non-intrusive hardware-based trace tool to overcome such a problem
Creator of next-generation cockpit systems
Amongst its solutions, ADIT deploys Linux on both Arm and Intel processors and makes use of SystemTap to measure overall System performance in order to locate and remove any bottlenecks. SystemTap makes use of some nice Linux Features called uprobe and kprobe which allow the user to create a dynamic trace of user level and kernel level functions, respectively.
Products
- Cover Operating Systems
- Hypervisor Technology
- Middleware-level Components of Automotive Products
A single call to uprobe was taking twice as long on the Arm device
Under light to moderate system loads there was no real problem and it was expected that a software tool such a SystemTap would have a small impact on the real-time performance of the overall system. What was unexpected was that on the Arm based platforms the system was slowing down significantly more than the Intel based platforms.
To confirm the problem, a dummy function was created and measurements taken on uprobe. That showed that a single call to uprobe was taking twice as long on the Arm device. Since uprobe internally uses kprobe, the initial suspicion was that kprobe was the culprit. This was wrong as kprobe actually ran faster on the Arm processor than the Intel one: clearly the problem was in the uprobe code.
Since the problem was in the software Tracing code, software tracing could not be used to locate the problem.
TRACE32 PowerTrace, our hardware-based trace tool
ADIT decided to use TRACE32 PowerTrace with hardware tracing capabilities. The Hardware-based trace has no impact on the timing of the target at all, allowing for very deep analysis on even the smallest code parts. Both Arm and Intel devices are capable of providing non-intrusive program flow information. For Arm, this is called Embedded Trace Macrocell (ETM) whilst Intel call their equivalent Intel Processor Trace (IPT).
Information about the execution of code is emitted via a set of dedicated pins. TRACE32 tools connect to these pins to collect this data and then analyze it to produce a functional flow of the application and detailed timing of each function.
TRACE32 records and analyzes the complete program flow
Even in complex environments, TRACE32 is able to record and analyze the complete program flow, including user level applications and kernel code. The functional flow of the whole system is reconstructed and shown statistically, as a timing graph or as function hierarchy.
The display of a run of a full Linux system, including kernel and processes results in a very big chart but TRACE32 assists you in analyzing the critical parts. This allowed engineers at ADIT to tightly focus on the kprobe and uprobe portions of the kernel.
TRACE32 records and analyzes the complete program flow
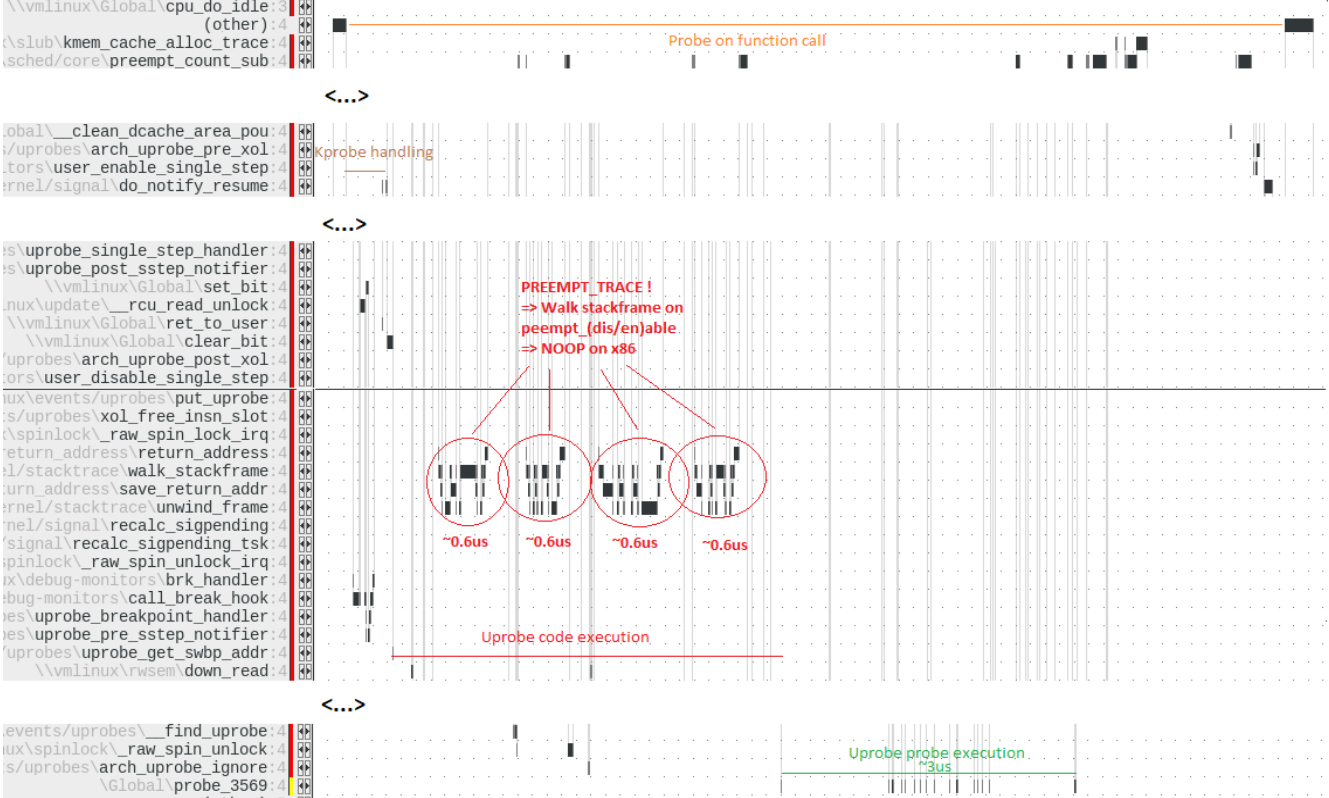
Without the real-time trace this would have been almost impossible to find; with the real-time trace it was a simple task to track it down. Knowing where to look, ADIT identified the main problem was in the kernel configuration. In migrating it from another platform, a temporary setting of CONFIG_PREEMPT_TRACE had been inadvertently left enabled. The trace showed this resulted in a stack unwinding on Arm but a “no-op” on Intel, which caused the huge performance discrepancy between the two. Using the advanced analysis features of TRACE32 it quickly became apparent that there were two Bottlenecks (see Figure 1 & 2).
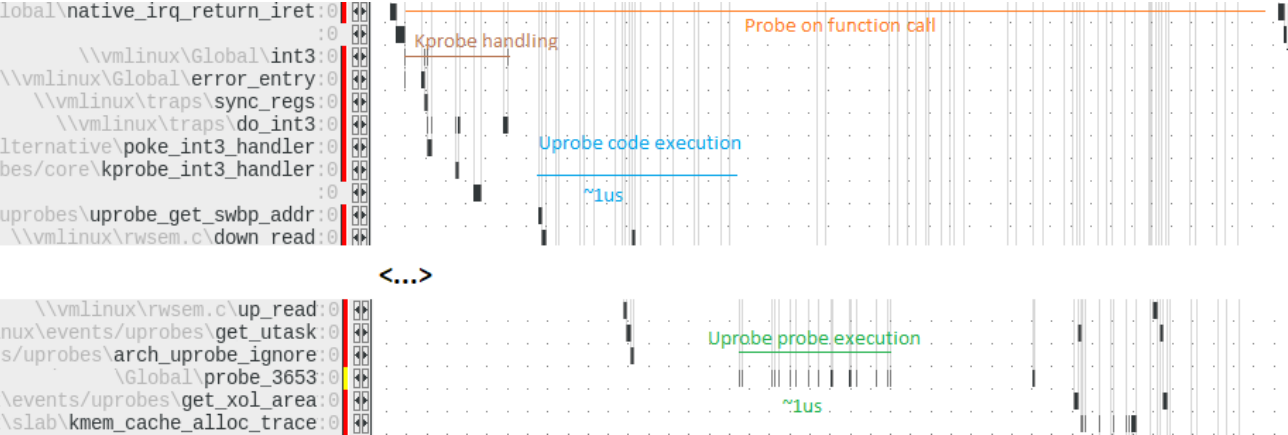
The most remarkable part was that uprobe on the Arm platform calls preempt_disable() and preempt_enable() four times, each of which causes a checking of the stack frame which took about 0.6μs and caused a total delay of 2.4μs. This did not occur on the Intel processors. A single difference of only 2.4μs might not seem like a lot but with many calls to uprobe each second it soon adds up to a significant delay. Digging deeper, a second bottleneck was identified as the string operations, which are a necessary part of uprobe. This one could anyway not be fastened as inherent to the architectural differences between Arm and Intel.