MEET US @ embedded world 2025
BOOTH 4-210
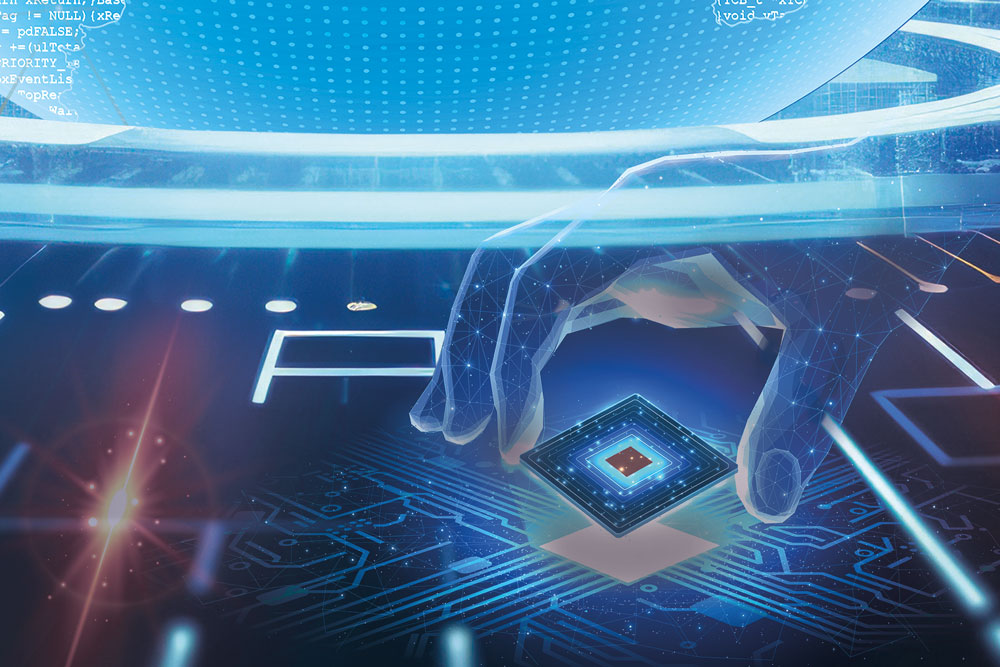
Enabling a Software-Defined Safe and Secure World
In an increasingly software-defined world, embedded systems can adapt and improve through software updates without changing the hardware. Today's hardware platforms are flexible and reconfigurable, allowing developers to optimize performance or add new features through software alone.
The benefits of reduced cost and development time come with new challenges in design, debug, and safety certification. At Lauterbach, we provide the tools to meet these challenges, backed by 45 years of experience and deep integration in the embedded systems industry.
Join us at embedded world 2025, March 11-13, 2025 in Nuremberg, Germany. Share your challenges with us and learn how we can help you bring your innovations to market faster and enable a software-defined, secure world.
We are looking forward to seeing you!
Your Lauterbach Team

Demos Which Really Matter: Five Highlights for Any Embedded Developer
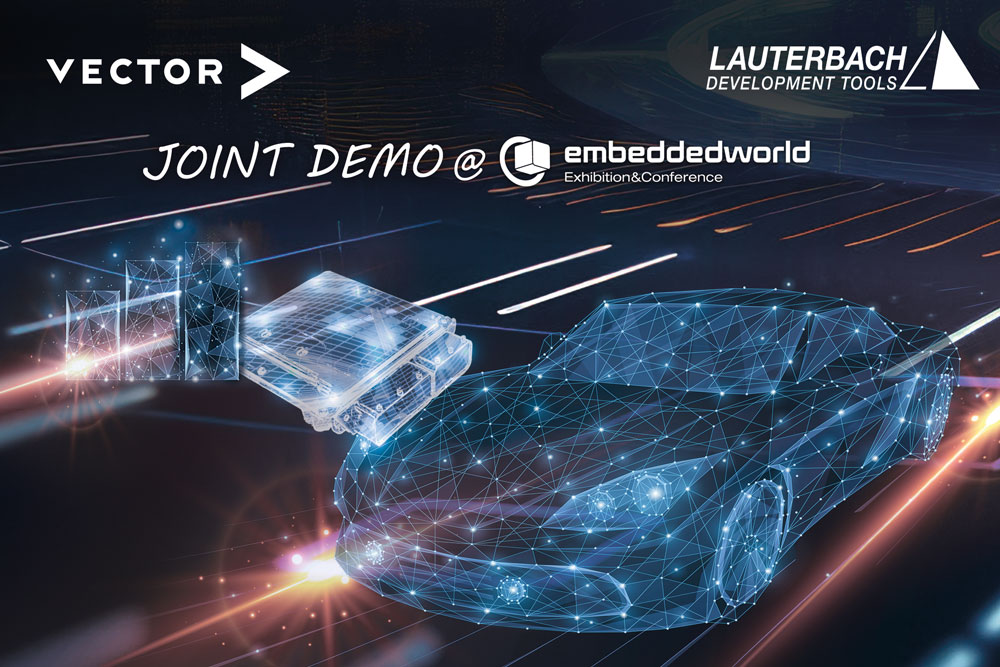
System Profiling in Virtualized SDV Architectures
When it comes to virtualized Software-Defined Vehicle (SDV) systems, where multiple OS are controlled by a hypervisor, it's not just about getting error-free software, but also understanding how the applications run in real time. This is really important for making the most of resources and performance, and ultimately for meeting all safety requirements.
On an Infineon AURIX™ TC4x MCU for SDV Zonal Controllers, which provides a virtualized environment with the help of the Vector MICROSAR Hypervisor, we demonstrate examples of timing analyses for the AUTOSAR platforms with full hypervisor- OS- and AUTOSAR awareness including debugging of virtualized workloads, using our TRACE32® Trace-Tools and the TA Tool Suite by our partner Vector.
Learn more about our Hypervisor and OS-Awareness and visit us at our booth.
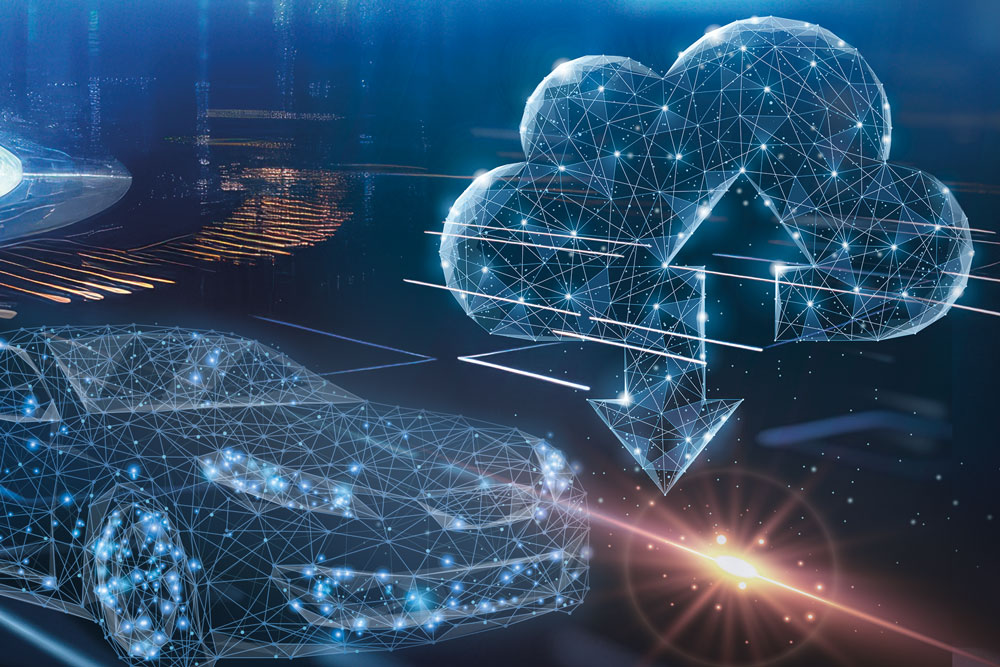
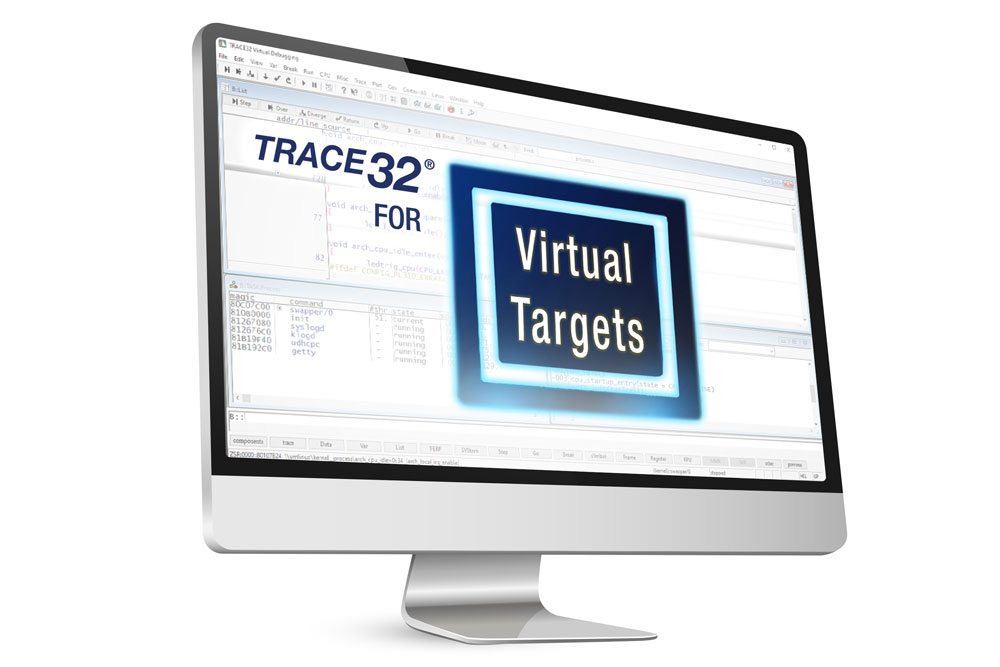
Shift-Left: From Real to Virtual Targets in Automotive
In order to speed up the development cycle, software development in the embedded industry is increasingly being shifted from real chips to virtual targets running in the cloud or Host-PCs.
Visit our booth to explore debugging exactly the same demos on real targets and their digital twins using the Synopsys Virtualizer Development Kit (VDK):
- Debugging and tracing all the TriCore™ and other cores implemented in AURIX™ TC4x even in virtualized environments
- Efficient bugfixing in a multi-AURIX™-scenario communicating over serial interfaces on real and virtual targets
- Getting advanced insights into the overall system by correlating program execution with analog and digital signals
Learn more about our support for simulators, emulators and virtual targets and the supported platforms and visit us at our booth.
Enabling High-Performance Computing with Arm®
High-Performance-Computing (HPC) applications running on powerful and complex Arm®-based multicore SoCs you can find in every conceivable application and industry.
At our booth we demonstrate high-end-Arm® cores running on real and virtual targets:
- Unlimited Multicore-Debugging in SMP and AMP configurations.
- Debugging of Arm® cores together with cores from other architectures on one chip.
- Performing Hypervisor- and OS-Aware debugging for maximum transparency on system level.
- Debugging on Corellium’s Arm RD1-AE Automotive Virtual Hardware Platform including the brand-new Arm® Cortex-R82AE and Arm® Neoverse-V3-Cores for HPC in SDVs.
- Experience source-level debugging of Rust applications for safety critical applications with Ferrocene qualified Rust compiler toolchain.
Learn more about our Arm support and visit us at our booth.
Debugging RISC-V Everywhere
RISC-V cores can be found in more and more chips - as the main CPU(s) or as a companion core together with other CPU architectures. As the leading tool supplier in the RISC-V ecosystem we showcase debugging on the newest and most exciting RISC-V cores and platforms, which will power billions of todays and future chips and embedded applications:
- Infineon’s Automotive RISC-V Prototype
- Debugging and testing on virtualized RISC-V platforms running L4Re hypervisor in QEMU
- Multicore debugging and tracing of two Andes A25 cores with the recently ratified RISC-V N-Trace standard
Learn more about our RISC-V support and visit us at our booth.
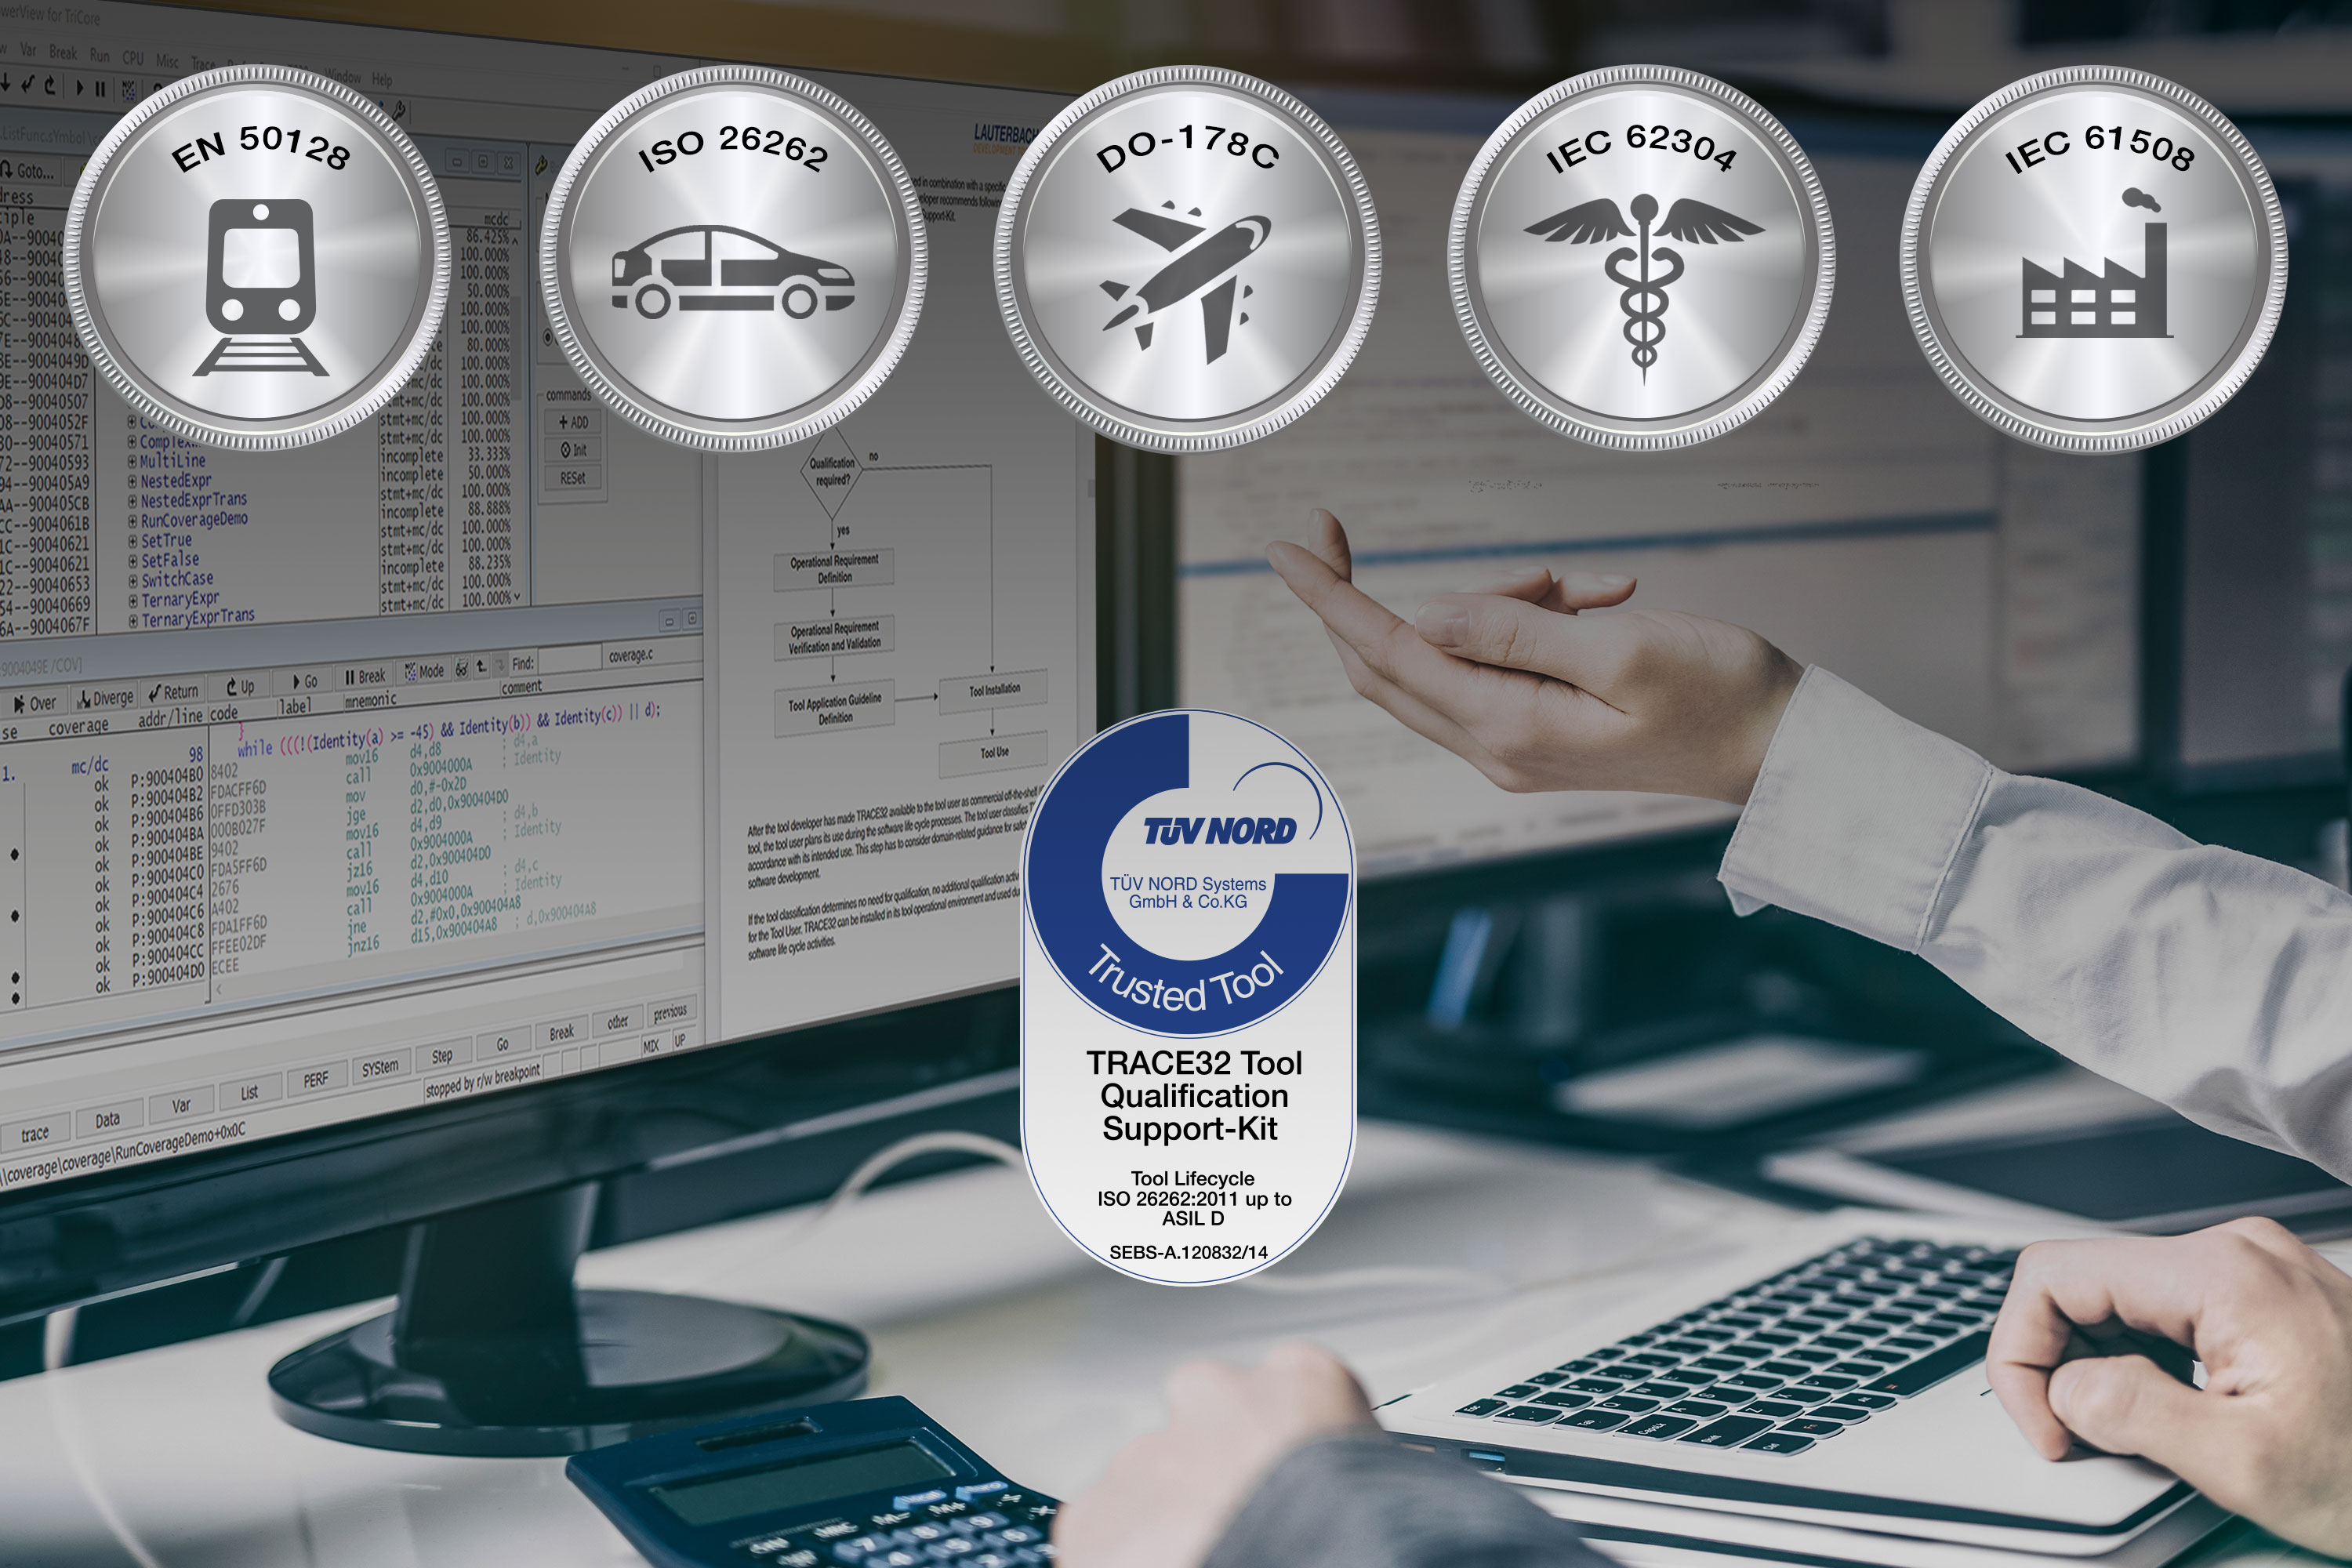
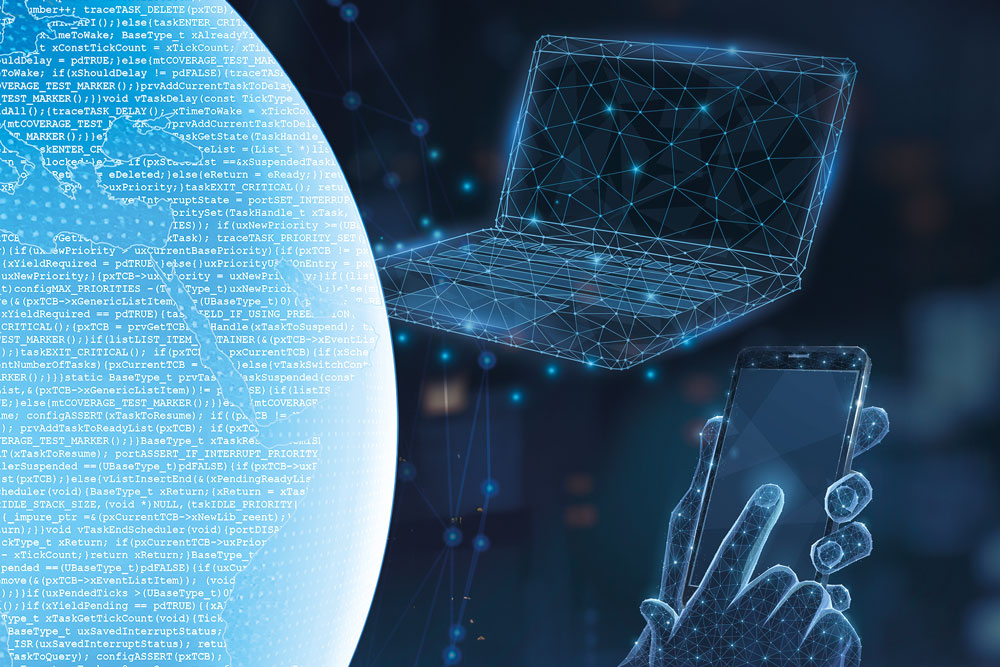
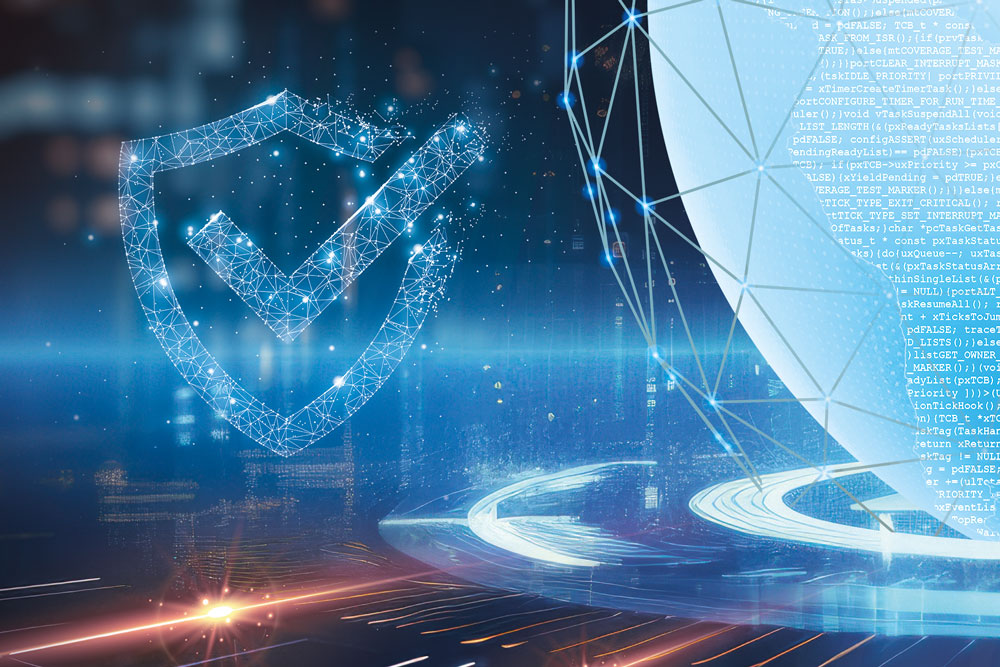
Enabling Safety in Software – Play and Win the Lauterbach Code Coverage Challenge
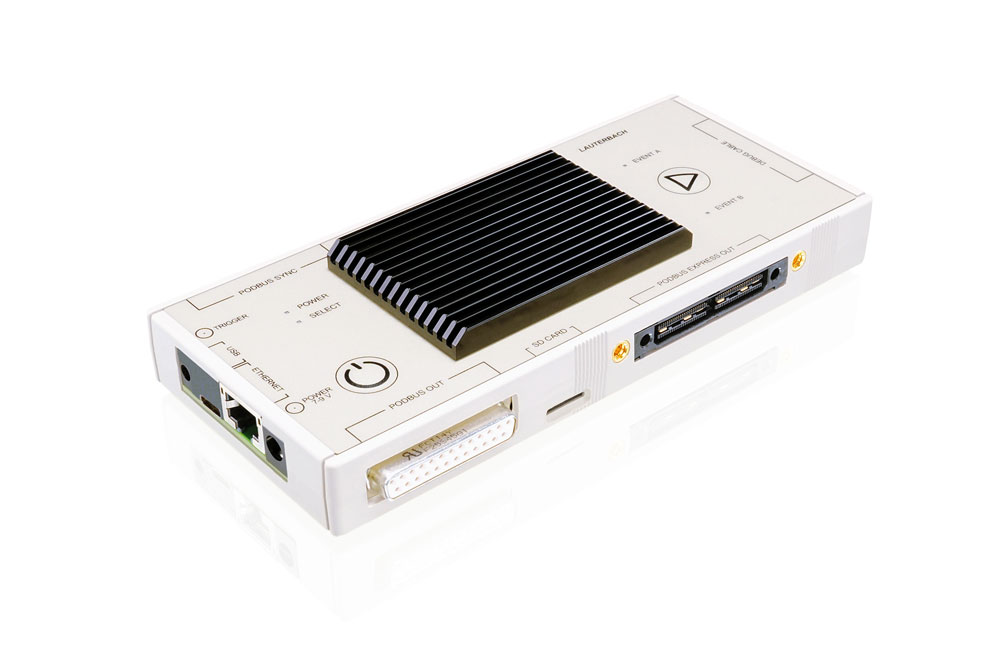
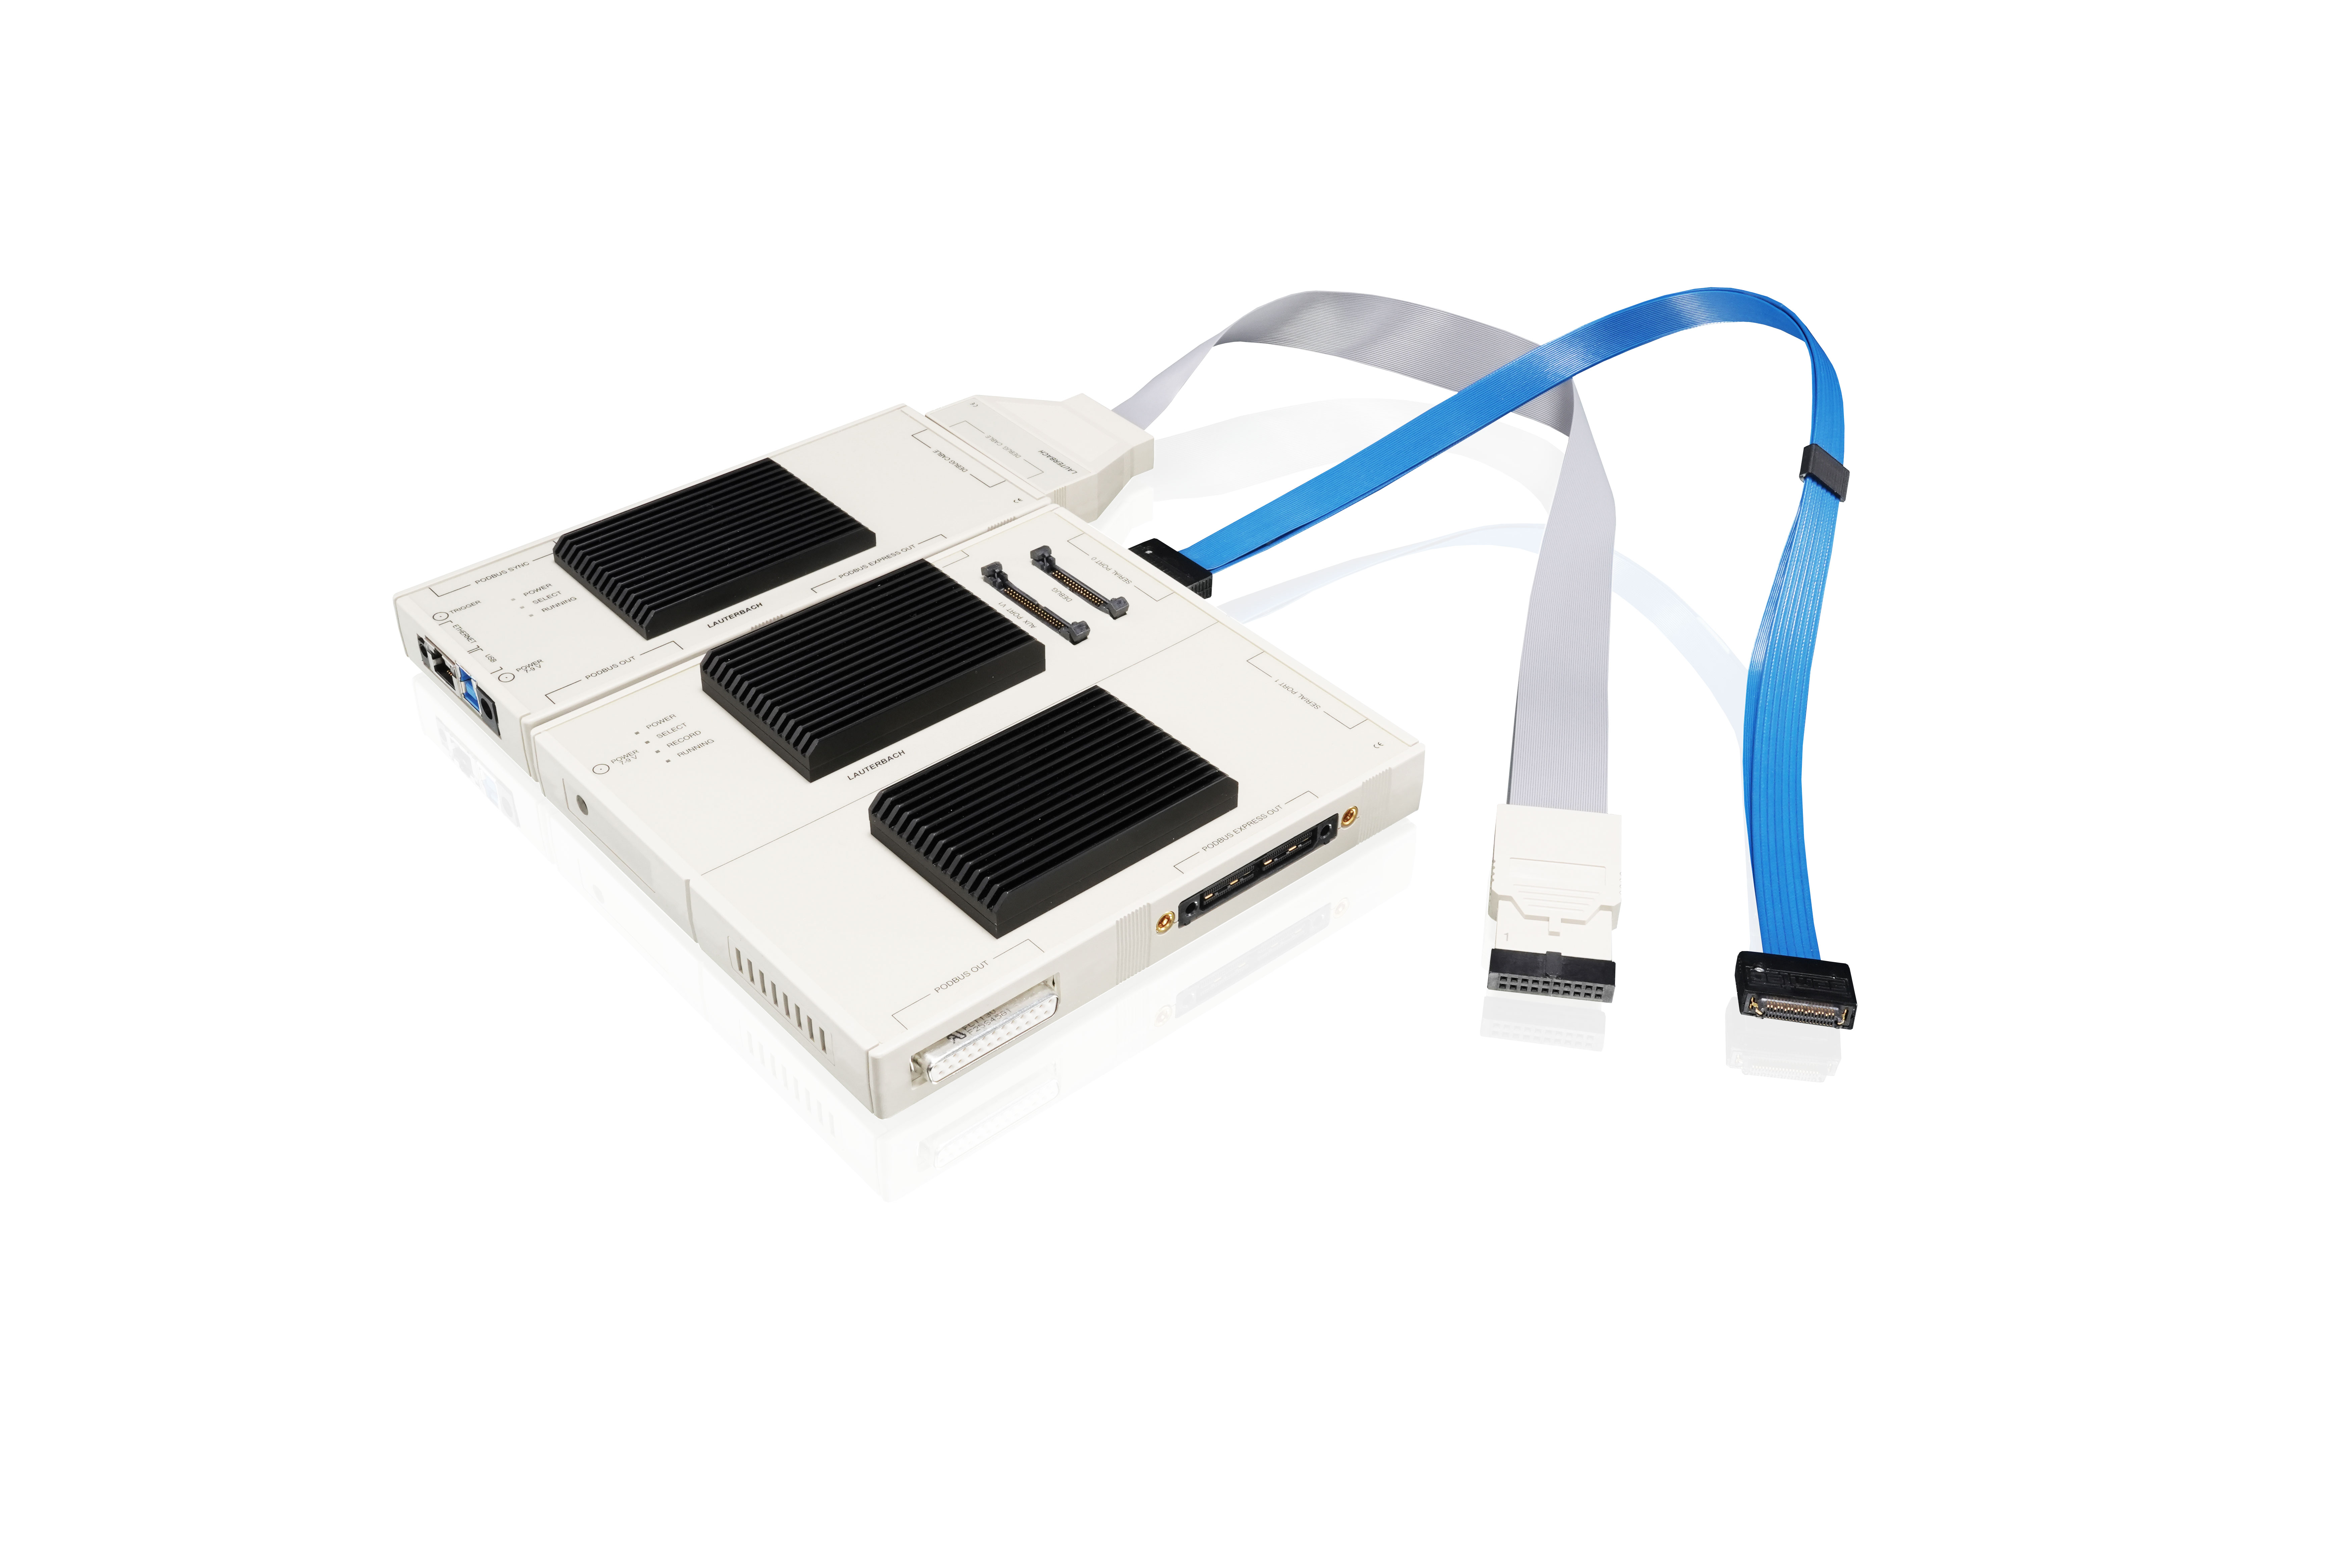
Proof of complete code coverage is essential for the certification of safety-critical embedded applications. Lauterbach’s TRACE32® tools help you to accelerate the process of achieving code coverage for your mission-critical software development providing trace-based code coverage measurements with no or a minimum amount of instrumentation.
Experience Code Coverage live at our booth and in real-time by playing Snake, the best-known and most popular single-player skill game of all time, and win a surprise gift. It’s a lot of fun!
In addition, visit our tool qualification web page for more information about tool qualification for functional safety.
Learn more about Code Coverage with TRACE32 and the Tool Qualification Support Kit and visit us on our booth.
Explore Our Products - Your Key to a Software-Defined Safe and Secure World
Leading the forefront of technological development, our aim is to provide you with the best possible tools to help you solve the challenges of tomorrow. Our experts will be happy to advise you on the optimum solutions for your development projects at our booth.