Hexagon Debugger & Trace
Hexagon DSP Cores as Part of Complex SoCs
Benefit from Lauterbach’s leading edge and unrivalled development tools to analyze all generations of Hexagon DSPs and its HVX co-processors in Qualcomm Snapdragon Mobile, Snapdragon Automotive, Cloud AI and other SoCs, stand-alone or in combination with Arm CPUs, Xtensa and other cores. Hexagon DSP cores are used in Qualcomm Snapdragon SoCs for media and sensor processing, dedicated modem processing and other tasks like AI.
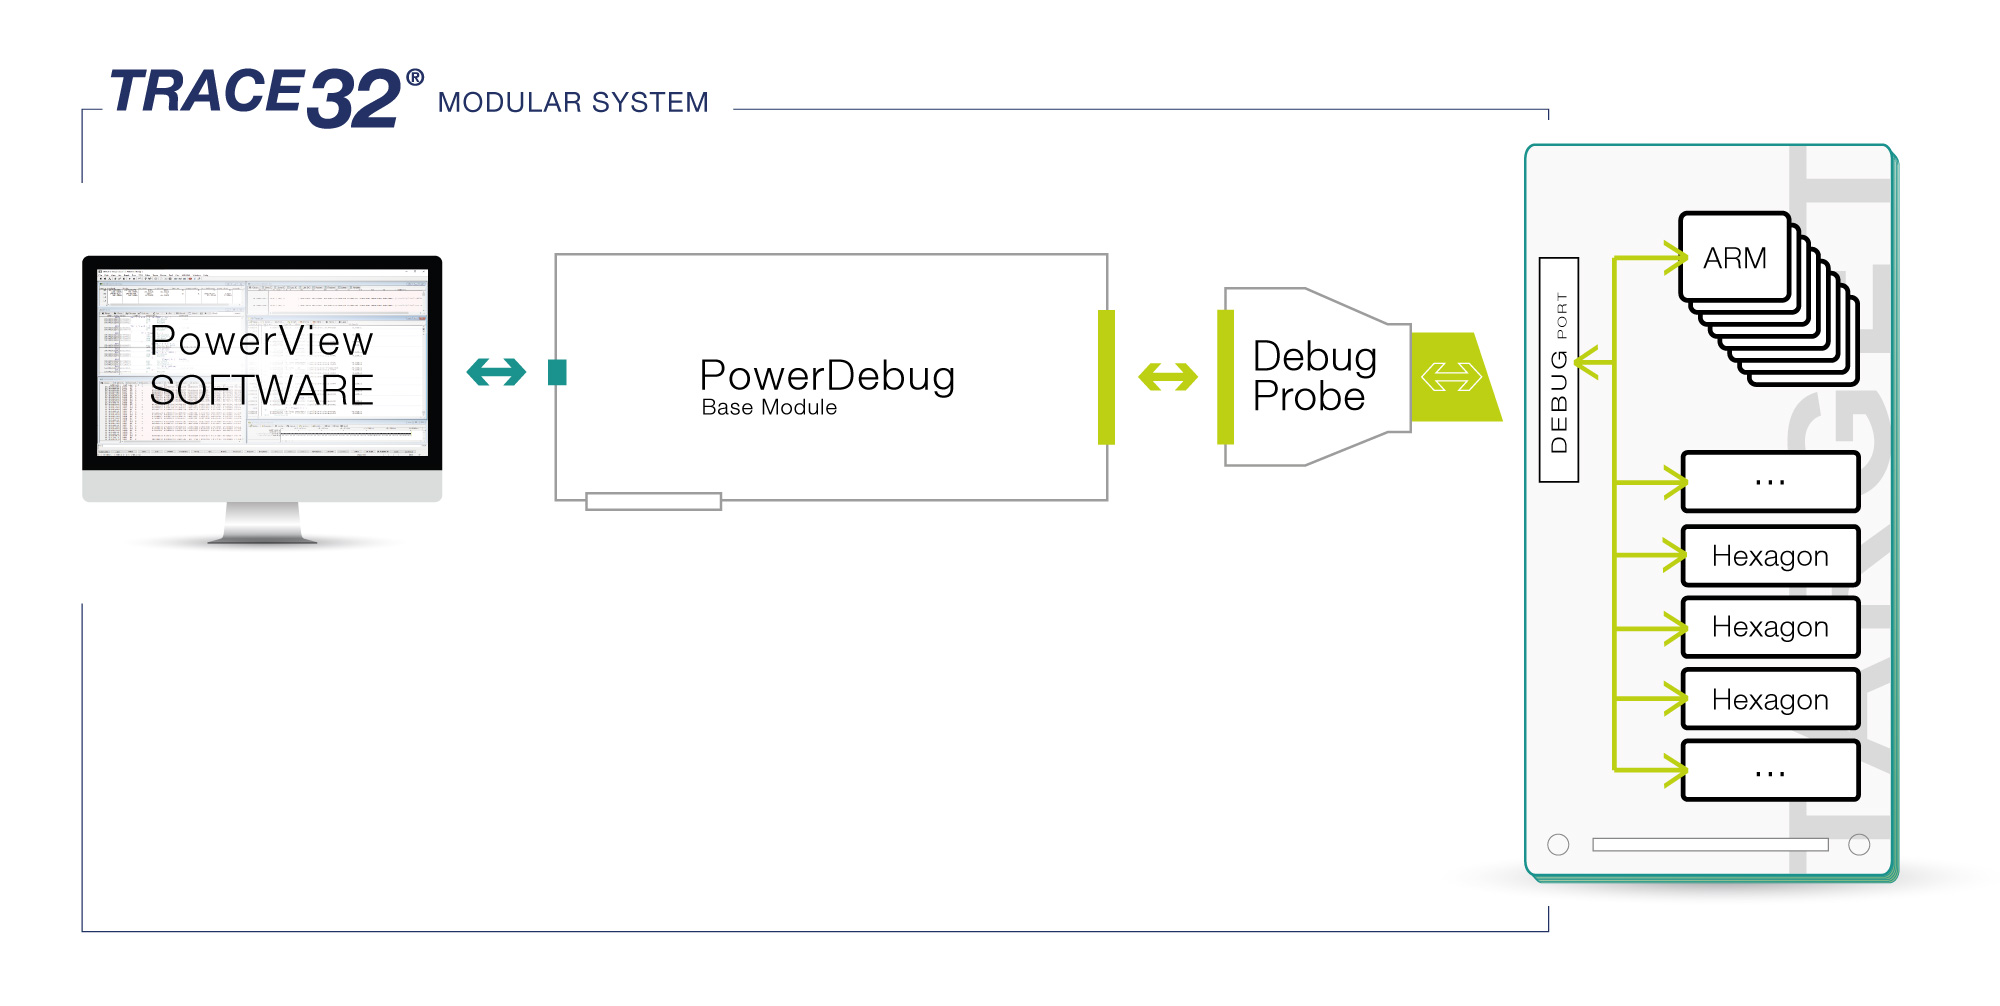
Furthermore, they are used in dedicated AI accelerators like Qualcomm Cloud AI 100. Only by using our TRACE32® tools you can debug and control any Hexagon core (along with other cores) in your SoC via a single JTAG or SWD debug interface, all at the same time. TRACE32® tools support on-Chip trace as well.
Supported Subarchitectures
Hexagon V2, V3, V4, V5x, V6x, V7x
Supported Sub-Architectures
Hexagon
Unique Feature Set and Core Support
Explore and utilize all the powerful features of your Hexagon DSP cores with Lauterbach debug modules at the highest performance: full on-chip breakpoint support; run-time memory access and benchmark counters to monitor and fine tune the performance of your application, non-intrusively. And of course, everything is scriptable, enabling you to repeat the same test-sequence over and over.
While stop mode debugging is a powerful tool, tracing is even better, because tracing captures your core’s actions. Our Hexagon Debugger can configure and use the ARM CoreSight trace infrastructure of your SoC, so you can route your trace data to the Hexagon On-chip trace buffer, SoC On-chip trace buffer, other memory like DDR or to an external trace port – whatever your chip and device provides. You can also export the raw trace data using your own tooling, e.g. via backdoors of emulation platforms, and then use TRACE32® to decode and display them.
Learn more about our debug system
Which Hexagon core do you want to use?
Check out our catalogue of predefined solutions and find the ideal toolset for your project.
Get Ready Before Your Silicon is
Test your Hexagon code in your before you hold the chip in your hands. TRACE32® allows you to start software development on virtual prototypes and simulators, using the same GUI and tool set that you would use with the real chip. Verify your SoC, including debug mechanisms, using simulated Verilog or VHDL netlists. The Lauterbach Generic Transactor Library (GTL) allows you to perform pre-silicon debugging on JTAG level.
Get in contact with sales3rd Party Tools Supported for Hexagon
The following features are available for all architectures supported by TRACE32. Please contact us if your device or tool is not listed here; support is often already on its way.


