AutoFocus Technology

Ensure Perfect Recordings for High-Speed Parallel Trace Ports
The trace port data rates of today's and future chips are getting higher and higher, which means that the time window for sampling valid data is getting narrower and narrower. Consequently, runtime differences on the trace lines or other small deviations in the target hardware can easily become a source of error for the trace recording. Fine-tuning the sampling timing is therefore very important. Our trace probes with AUTOFOCUS technology automatically perform the optimal tuning just by clicking a button in our PowerView software or even fully automated with a script or command.
Be Successful Even with Complex Trace Scenarios – Today and Tomorrow
Even though our AUTOFOCUS technology promises advantages in all conceivable trace situations, it shows its strengths most in challenging scenarios, such as extremely high clock frequencies, dynamically changing clock frequencies, or prototypes with suboptimal routings - in other words, where tracing with conventional trace probes reaches its limits. Our trace probes with built-in AUTOFOCUS technology are also a future-proof investment: Even further increasing clock frequencies are easy to handle thanks to the automatic optimal hardware calibration of your target. Once AUTOFOCUS, always AUTOFOCUS. No costly upgrade. No change of trace tools necessary.
Get Trace Data without Information Loss
Sampling high-speed parallel buses require special concepts to compensate for the effects of wave reflections, component tolerances, different trace lengths, limited pad driver capabilities, signal coupling and more. All these effects might add up to a reduced signal amplitude, jitter, and channel-to-channel skew. While conventional Trace Probes may not be able to compensate for these issues - even if they support high data rates in theory – our Trace Probes with AUTOFOCUS technology get the trace signals from the target without any information loss: It calculates optimal sampling points for every data channel and performs an automatic hardware configuration including setting up the ideal termination voltage, the ideal clock delay, and the ideal delay for every single data line.
Set Up Optimal Sampling Points for Arm Cortex-M Parallel Trace
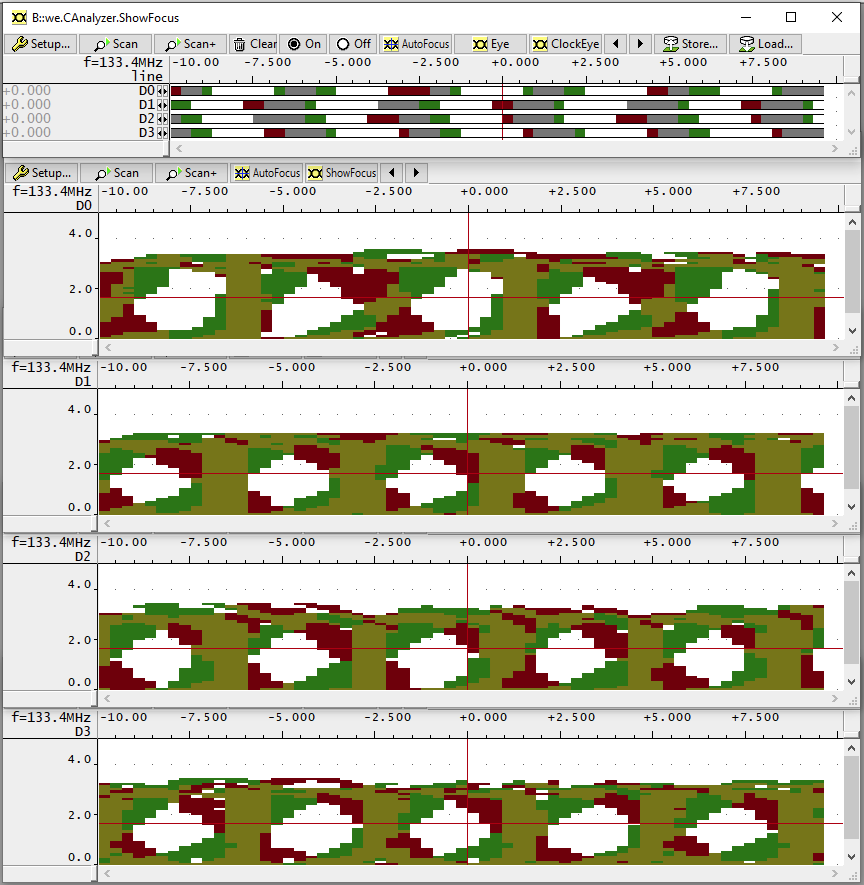
The image shows the automatic adjustment of sampling points on an Arm Cortex-M7 based microcontroller. It implements an ETM (Embedded Trace Macrocell, an IP block provided by Arm) interface with a 4-bit data port, the individual data lines are called D1 to D4. When using the default sampling points, it is easy to see that the sampling points for the signals D1 and D2 are unsuitable, since they are located outside the corresponding data eyes. After clicking the button AutoFocus in our PowerView software, the automatic hardware adjustment is started in which the sampling points are moved so that they are located in the center of the data eyes.

