TRACE32®
PowerView Software

The Only Debug Software You’ll Need for All Your Targets
The TRACE32® PowerView software is our central front end for all your debug and trace activities, no matter which hardware modules or software-only solutions and irrespective of which targets you use. It provides you with a uniform GUI in all your projects and has enjoyed a very high reputation in the embedded community for many years, not only because of its almost unlimited, industry-leading debug and trace features, but also because of its exceptionally high stability and reliability.
Let PowerView exceed also Your Expectations
Even though our TRACE32® tools support the most chips, the most architectures and the most complex SoCs in the tools market, in the end it all comes down to the user experience with the development tools used. Our PowerView software frontend has been constantly evolving for more than 40 years to provide the features our demanding customers need to perfect their embedded innovations, from standard to even the most complex debug and trace scenarios. Let us surprise you, too, with all the features PowerView has to offer for your use cases.
A Single GUI for Everything
PowerView is your front-end interface for all architectures, chips and targets and makes switching from one CPU to another or from simulation to real silicon a breeze. No relearning, no reinstalling. Once PowerView, always PowerView.
Fully Automate Debug and Trace
By using our script language, PRACTICE®, you can fully automate all your debug and trace activities. As a base, we provide over 7,600 pre-built, comprehensive scripts that you can use out of the box or easily customize to your needs.
Benefit from Exceptional Stability
For many years, our customers have praised the outstanding stability and reliability of the PowerView software. This saves you time, effort and, ultimately money.
Extend PowerView with OS-Awareness
If you run one or even more operating systems (e.g. as guest OSes under a hypervisor) on your target, you can add OS awareness files - and hypervisor awareness files, if used - to debug and trace the complete software stack.
Connect Third Party Tools Easily
The PowerView Remote API enables you to control and access the target from third-party programs e.g. to integrate your tools into an automated production environment, to debug targets distributed around the world or access a target room from everywhere.
Run PowerView on all Major OSes
Which operating systems are used for your host PCs in your company does not matter for PowerView. You can install and run it on all major operating systems, including Windows, MacOS, and Linux.
Discover Supported Host OSSave Time with Peripheral Register Display
To read and write peripheral registers, you normally have to find an address and the bit position in it from the CPU manual. PowerView displays the peripheral registers for thousands of chip derivatives with their name, which you can easily search for.
Merge Program-Flow and Target-Signals
By using one of our logic analyzers you can record digital and analog signals. PowerView allows you to correlate them to the program flow within a single UI. This way you can easily verify signal timings or calculate the power consumption of certain program parts.
The GUI for all of Your Use Cases
PowerView provides you with a consistent GUI and feature set for all use cases. Depending on your requirements, you can debug a real target via our hardware modules or a pure software solution via USB or XCP. You can also work without a target, with simulators, emulators, virtual targets or with our built-in instruction set simulator. No matter which approach you choose, your PowerView remains the same.
-
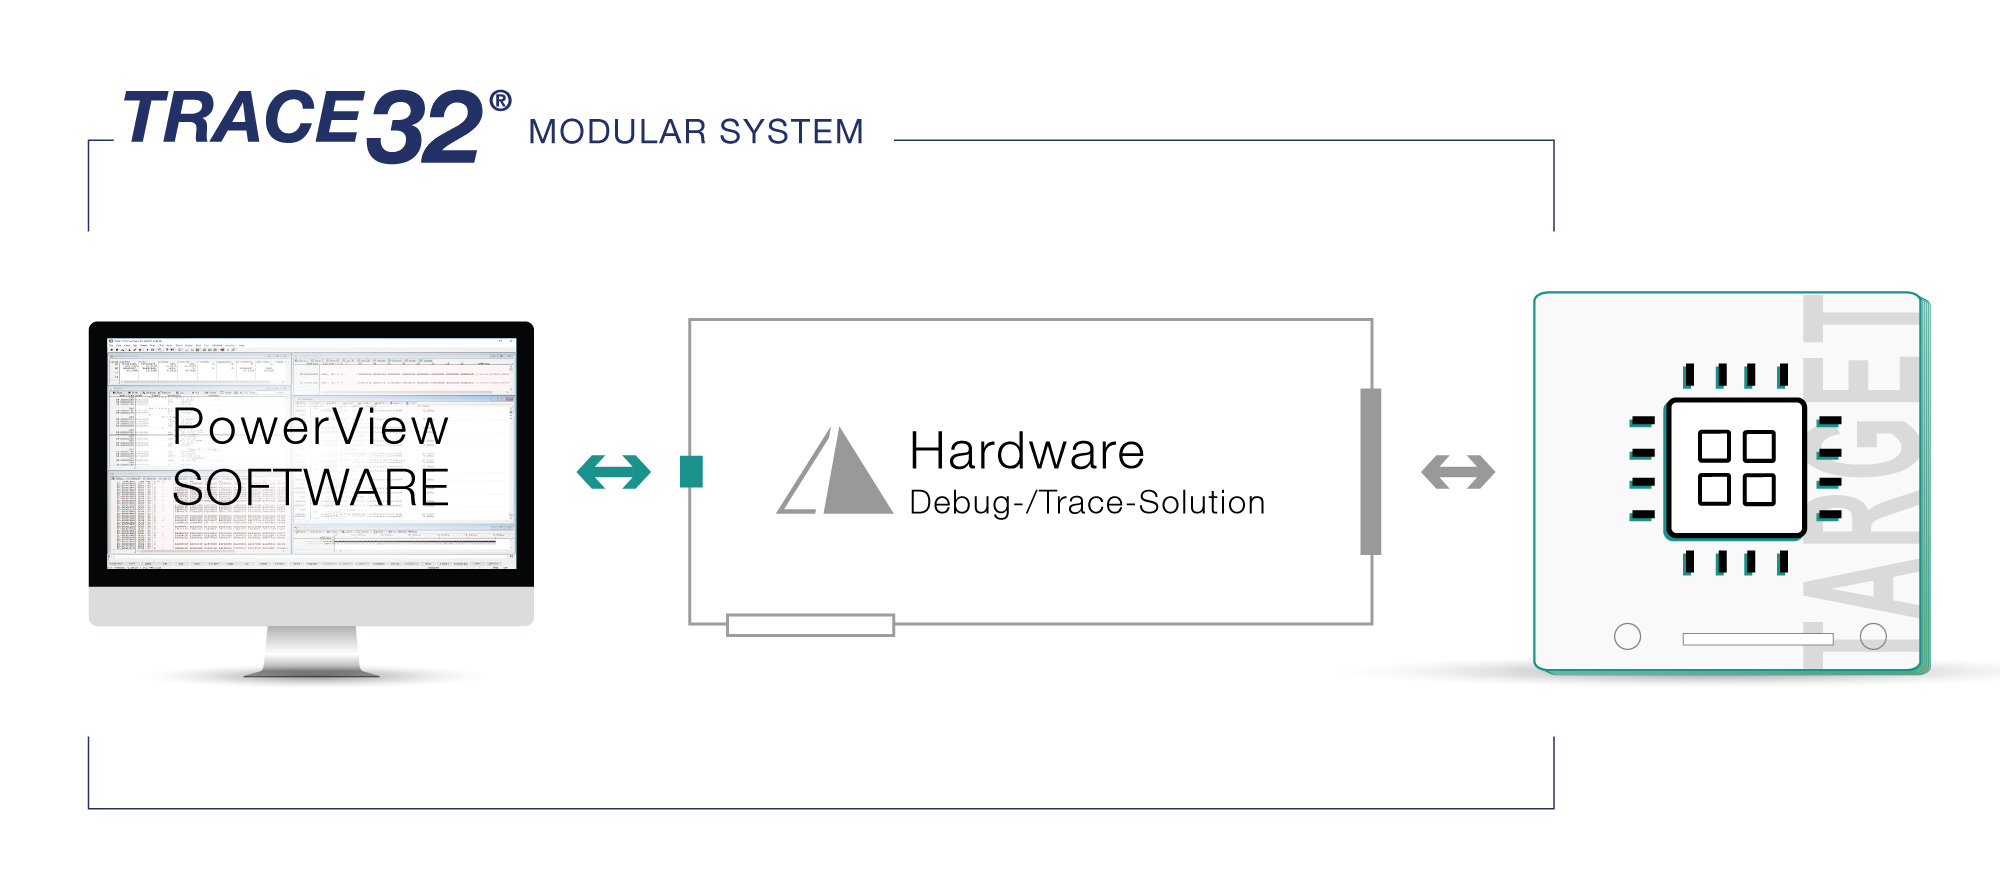
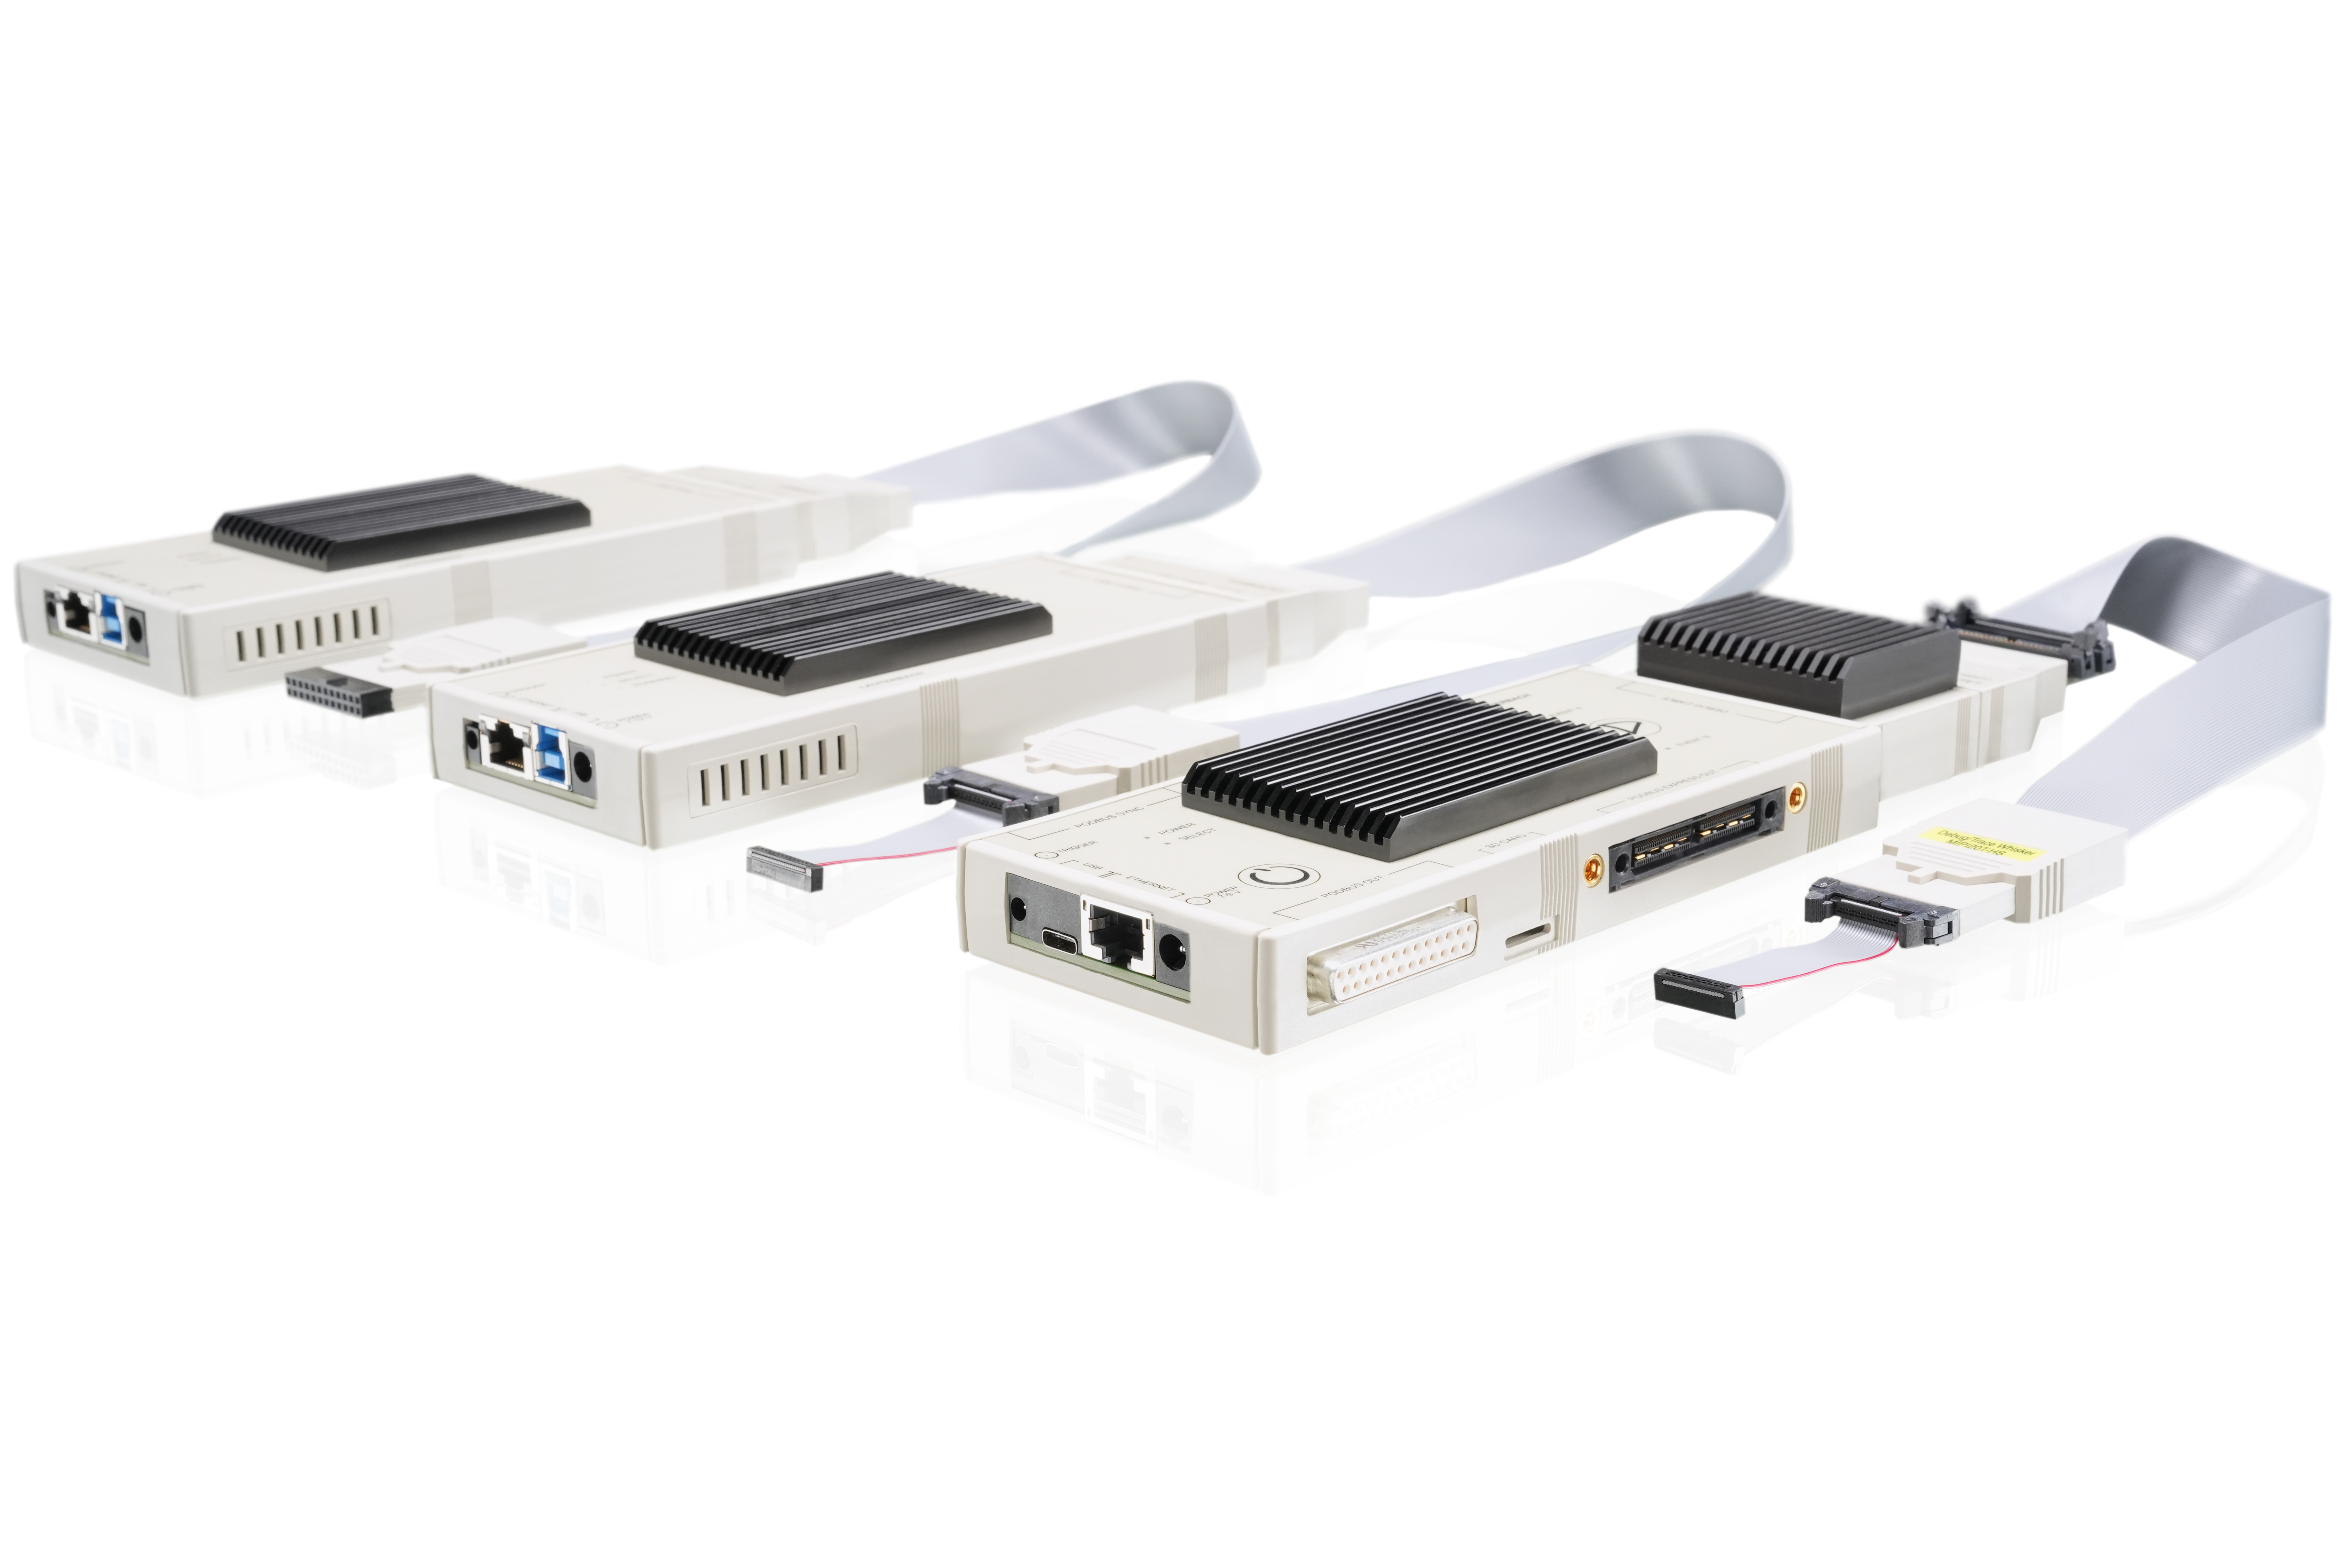
Deployed in combination with our hardware modules, PowerView can get the maximum debug and trace performance from more than 10 000 chips, irrespective of how fast or complex they are. Whether debug module, trace extension, All-in-one Debug- and Trace solution or logic analyzer, PowerView is perfectly matched to all components and allows you to get the most out of your hardware.
-
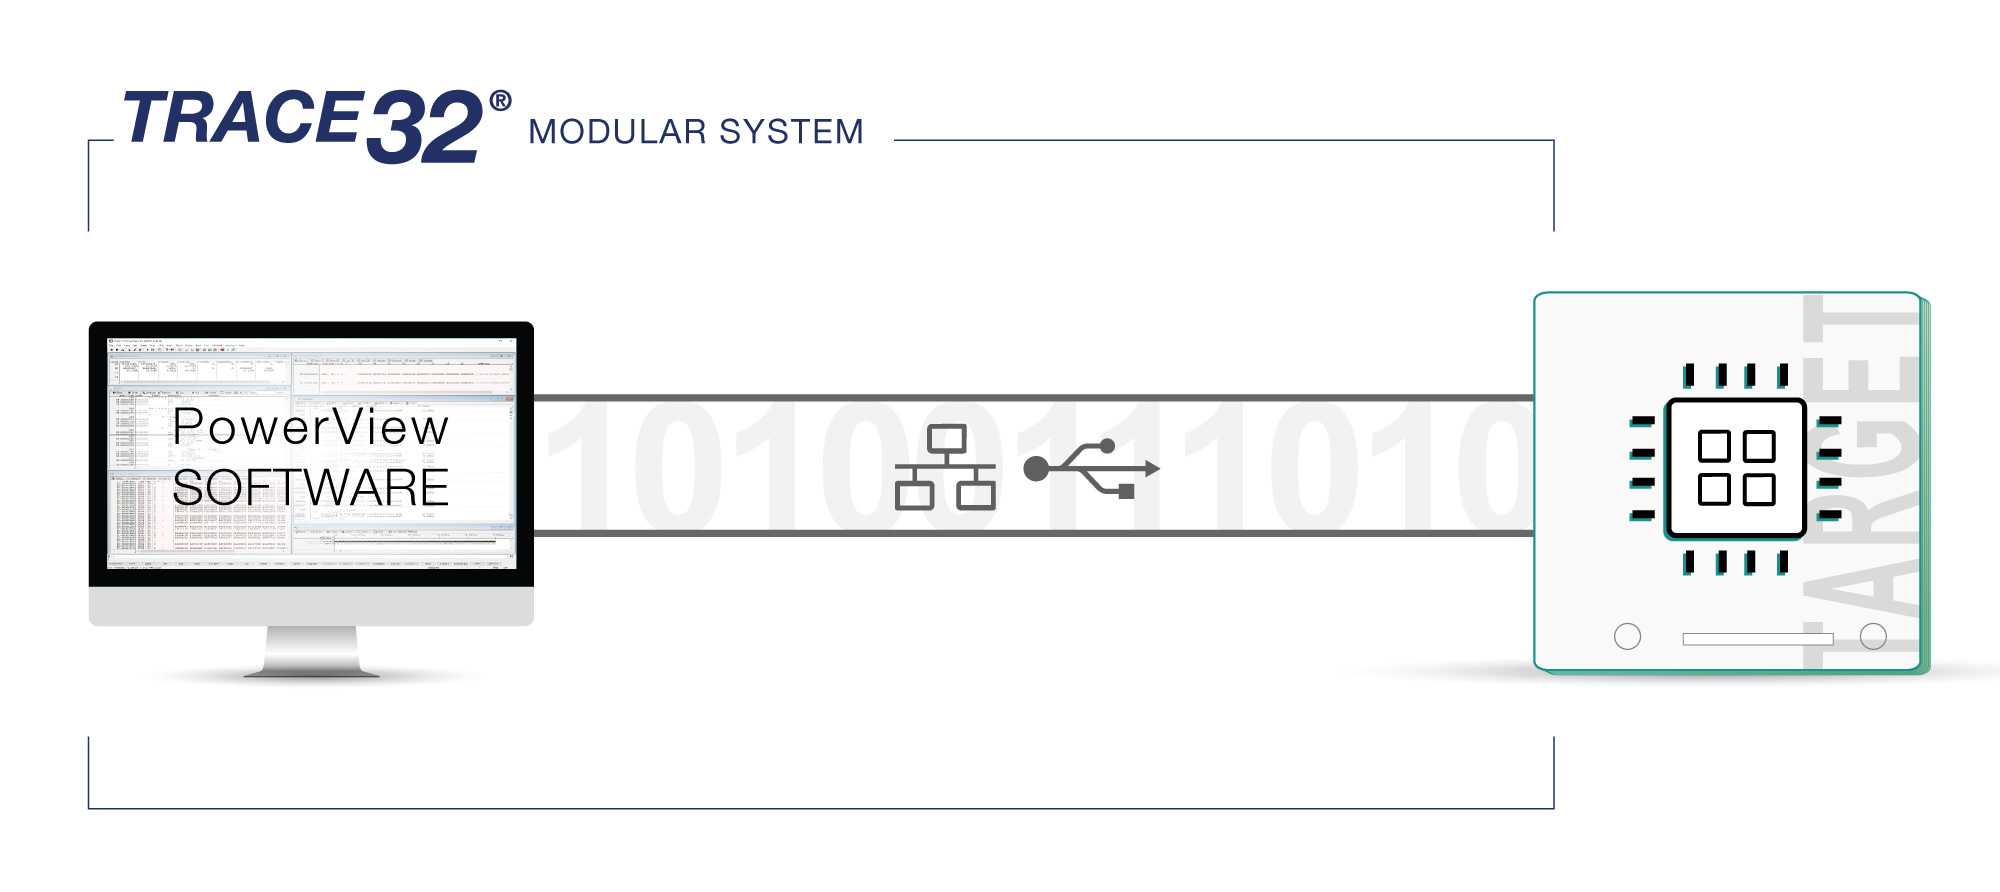
PowerView supports several silicon IP solutions that enable full debug and trace functionality, without limitations, by using a USB connection between the target and your (host) computer as well as XCP debugging for all automotive processor architectures via a TCP/IP connection over ethernet.
-
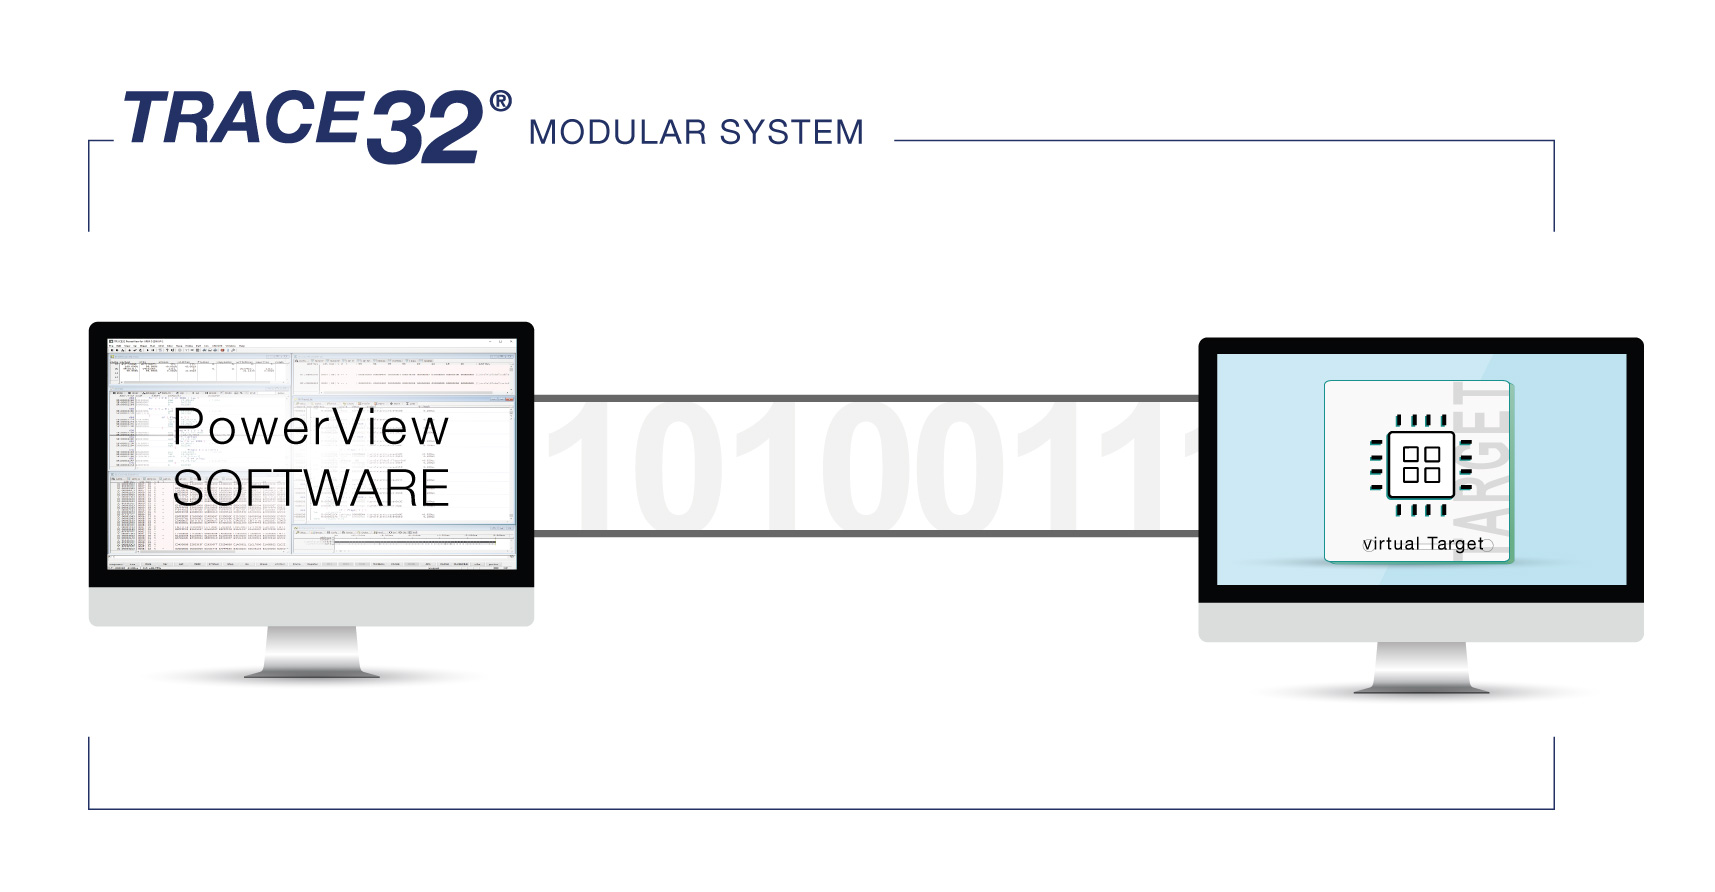
In addition to using real targets, PowerView can connect to various simulators, emulators, and virtual targets as well. You can reuse the scripts generated in this phase throughout the entire product life cycle because the user interface and scripting commands stay the same from simulations through use in the field by your customers.
.jpg)
PowerView provides an Instruction Set Simulator as a built-in-feature to develop or test your application code without the need for a target hardware. It is freely available to all owners of a TRACE32 debug module. The instruction set simulator is also available as trial version for evaluation.
Designed to meet your Requirements for all Your Current and Future Projects
After 40 years of partnering with the world's largest and most famous technology companies across all continents, we know where embedded application developers are most often at a loss when it comes to troubleshooting and what functionality they need and expect to achieve their goals quickly and easily. Year after year, we integrate this knowledge into our latest PowerView software releases in the form of more new and increasingly innovative features. So that you can make it even easier to keep your customers happy with your embedded innovations.
Debug your Embedded System without Limits
Heterogeneous and Homogeneous Multicore Debugging
PowerView supports both SMP systems (Symmetric Multiprocessing), and AMP systems (Asymmetric Multiprocessing). Even simultaneous debugging of multiple cores of different architectures is possible.
Coupling of Source and Assembler Code
After stopping the CPU, PowerView can show you not only where your program counter is in the machine code, but also on which instruction in your high-level language code.
OS Awareness
Thanks to our TRACE32® OS awareness technology, PowerView can access and display all components of the OS and the application. It supports MMUs and virtual memory addressing as well.
Hypervisor Awareness
PowerView can access the context of Virtual Machines (VMs), so you can check and change the current state of every single process, all VMs, the hypervisor and the real hardware platform.
Advanced Breakpoints
PowerView supports breakpoints that trigger on data values or conditions or even accesses to memory locations. You can also count all events from the CPU, e.g. clock cycles, cache hits and cache misses.
Trace for getting Full Insights of Your Embedded System
Heterogeneous and Homogeneous Multicore Tracing
PowerView can capture and analyze the program flow, task switches, data of several cores, and other system sources at once in far more detail compared to other tools, for both SMP and AMP systems.
Code Coverage
With our trace modules, PowerView provides code coverage analysis non-invasively, without instrumentation, and thus without violating the runtime behavior.
Context Tracking System (CTS)
Our Trace-based Debugging system (CTS) allows you to recreate the full state of the target system and to debug program steps again in PowerView. It’s even possible to fill most trace gaps caused by limited bandwidth.
Streaming
You can capture extremely long-term trace recordings by streaming the trace data to your host PC for later analysis in PowerView. High streaming speeds ensure a reliable transfer without data loss.
Statistical Analyzes
With PowerView you can perform a numerical analysis of recurring events such as function calls, interrupts and tasks and display the minimum, maximum and mean execution times in each case.
Timing Diagram
PowerView shows symbols, like functions, when they are running, when they are interrupted, what they are interrupted by (e.g. interrupt) together with corresponding timestamps.
Executed Instructions
The individual instructions at machine code level are not only displayed with a time stamp, but PowerView also provides you with a reference to the corresponding source code.
Merge Program-Flow and Target-Signals with Logic-Analyzers
Unique User Interface
With PowerView you can drive all kind of tools from one unique user interface. This approach reduces your training time making you more productive and allowing you to focus on the problem instead of juggling multiple disparate tools.
Matching Signals to the Application Code
PowerView provides an unrivalled number of tracking and cross-correlation options between logic signals and program flow trace. You can perform complex analyses such as best/worst case latencies and signal-software cross-timing.
Protocol Analysis
As well as sampling the raw signals, PowerView has built-in support for analyzing a number of industry-standard protocols, such as ASYNC (RS232), CAN, I2C, I2S, SPI, JTAG, and SWD. You can add support for your own protocol analysis as well.
Energy Profiling
PowerView allows the recorded current and voltage to be directly correlated in time with the program, so you can easily determine where your application code is most and least energy efficient and locate areas of minimum, mean, and maximum power consumption.
Maximize Your Productivity with Automation
Easy Integration into Your Production
PowerView enables the easy integration of your TRACE32 debug- and trace tools into an automated production environment or to use it as an interface to the device under test for test and measurement systems.
Full Scriptability
Our script language PRACTICE® allows you to fully automate all your debug and trace activities. As a base, we provide over 7 600 pre-built scripts that you can use out of the box or easily customize to your needs.
Python-Scripts
PowerView includes a Python interpreter that allows you to run your debug scripts created in Python without having to rewrite them into PRACTICE®. We can even debug Python scripts in the Python IDE while PowerView is remotely connected.
Download manualRemote APIs
The PowerView Remote API enables you to control and access the target from third-party programs. It is available for C, C#, .NET, Python and TCL. The Remote API can be used to control several PowerView instances simultaneously.
Download manualMaximize Your Debug and Trace Experience
Complementary to our PowerView software, our TRACE32® tool suite includes several leading-edge hardware and software components that enables you to analyze, optimize and certify all kinds of embedded systems. The intuitive modular design of our tools provide you with the highest available performance today and a system that adapts and grows as your needs change.