PowerTrace System

See your Code in Action
Imagine you have full insights of what your embedded system is doing without impacting its real-time performance in any way, creating a record of each step along the way. You could determine the performance of your application and coverage data for certifying your safety critical application. You could bring your embedded designs to market faster and more reliably than ever, while creating a safer and more stable product. This is what trace-based debugging gives you.
Lauterbach’s selection of PowerTrace extension collect information while the system under examination is running normally, without interruption. You can instantly start examining the data, as it is translated and displayed, using the same TRACE32 PowerView GUI you already know from debugging. With this comes all of the control and scriptable actions you are used to from Lauterbach TRACE32 tools.
Why Real-Time Tracing
Traditional debugging is like taking snapshots of a car race as the cars speed past you: you miss most of what happens during the race. Trace based debugging is like having access to the car’s on-board telemetry, track conditions, and driver actions. Each action and its time is recorded.
Program flow data provided by our PowerTrace extensions shows you exactly which instructions have been executed and how long it took to execute them. By using real-time tracing, you can:
- Locate hard-to-find bugs that only occur at run-time.
- Find timing bottlenecks in your code.
- Ensure that your application meets all timing requirements.
- Create code coverage reports for certification.
Many embedded processors are capable of providing this level of detail about the software being executed, without interfering with the application being tested. All you need are the right tools to collect any available information and to analyze it: Our PowerTrace.

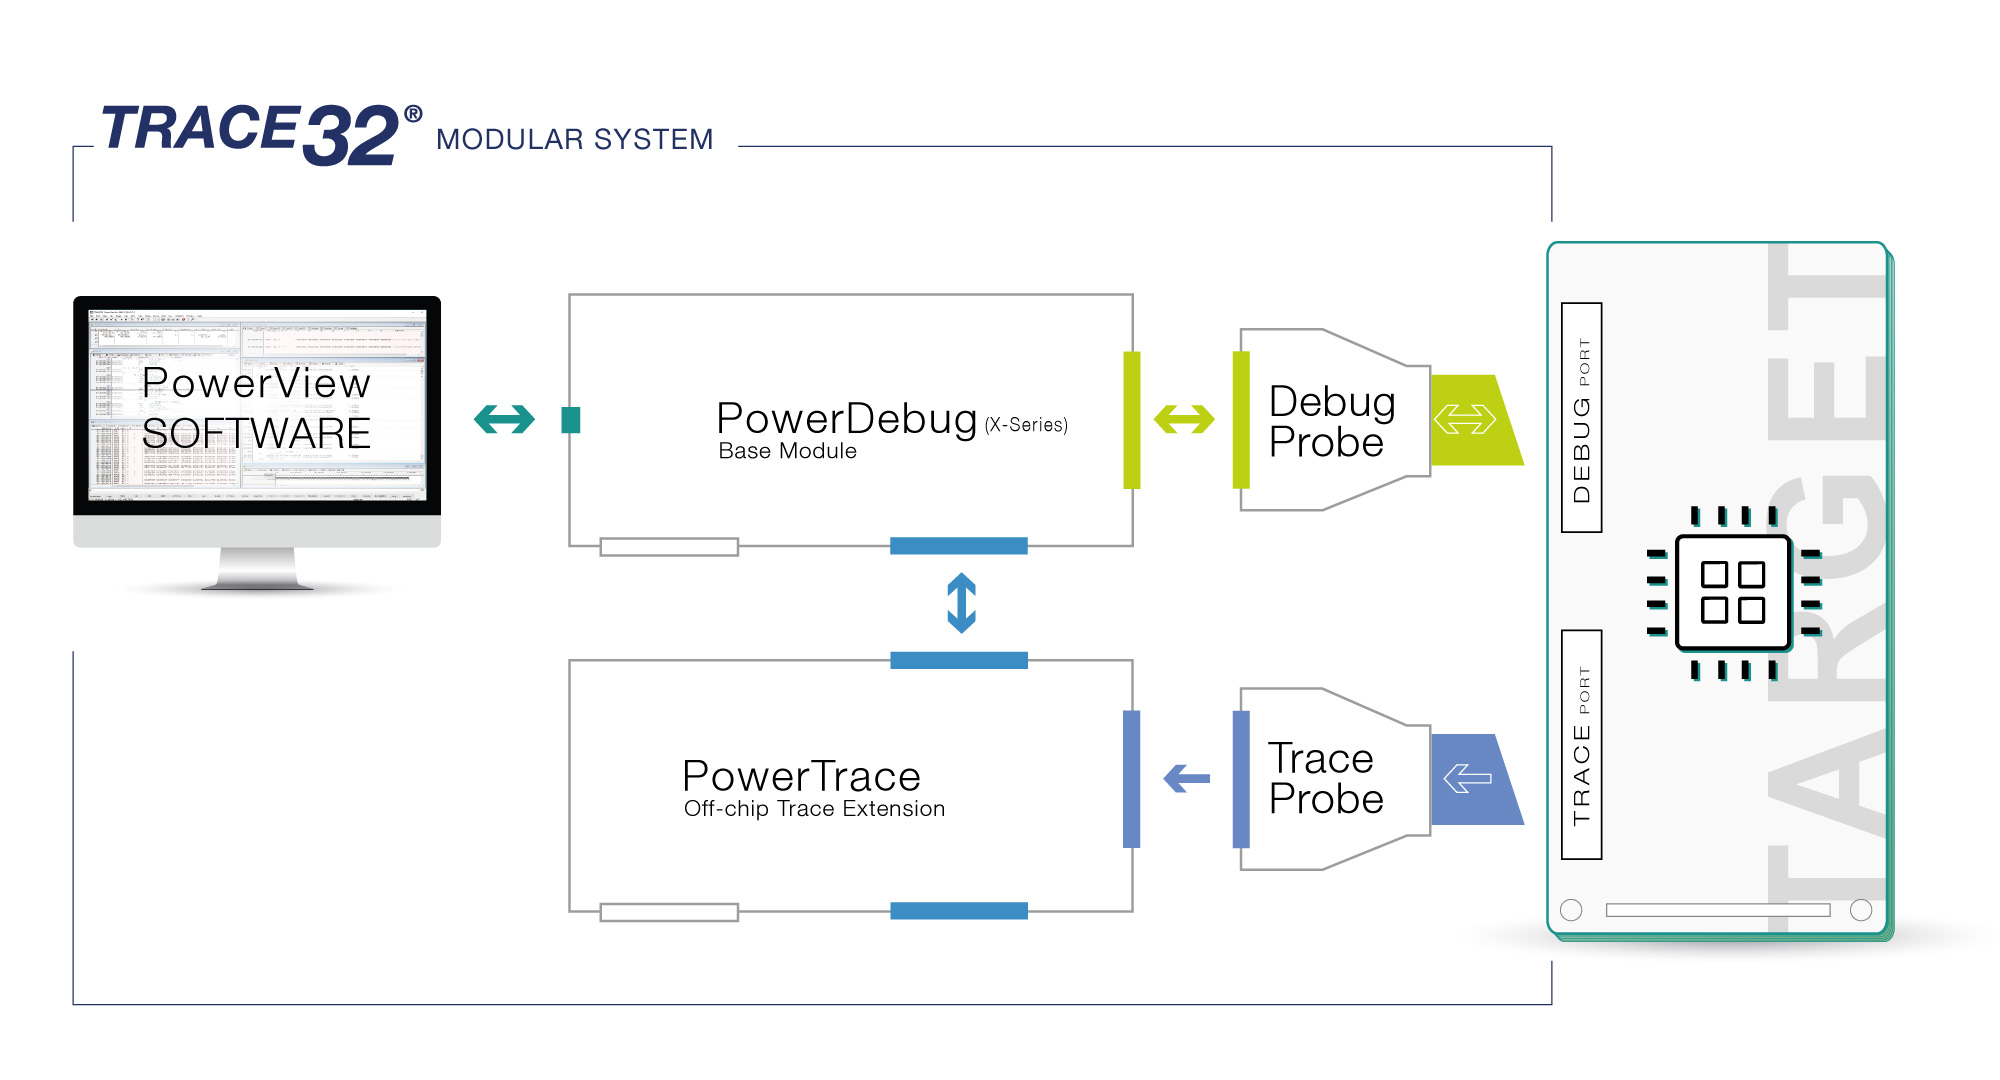
Extend your PowerDebug X51 with a PowerTrace
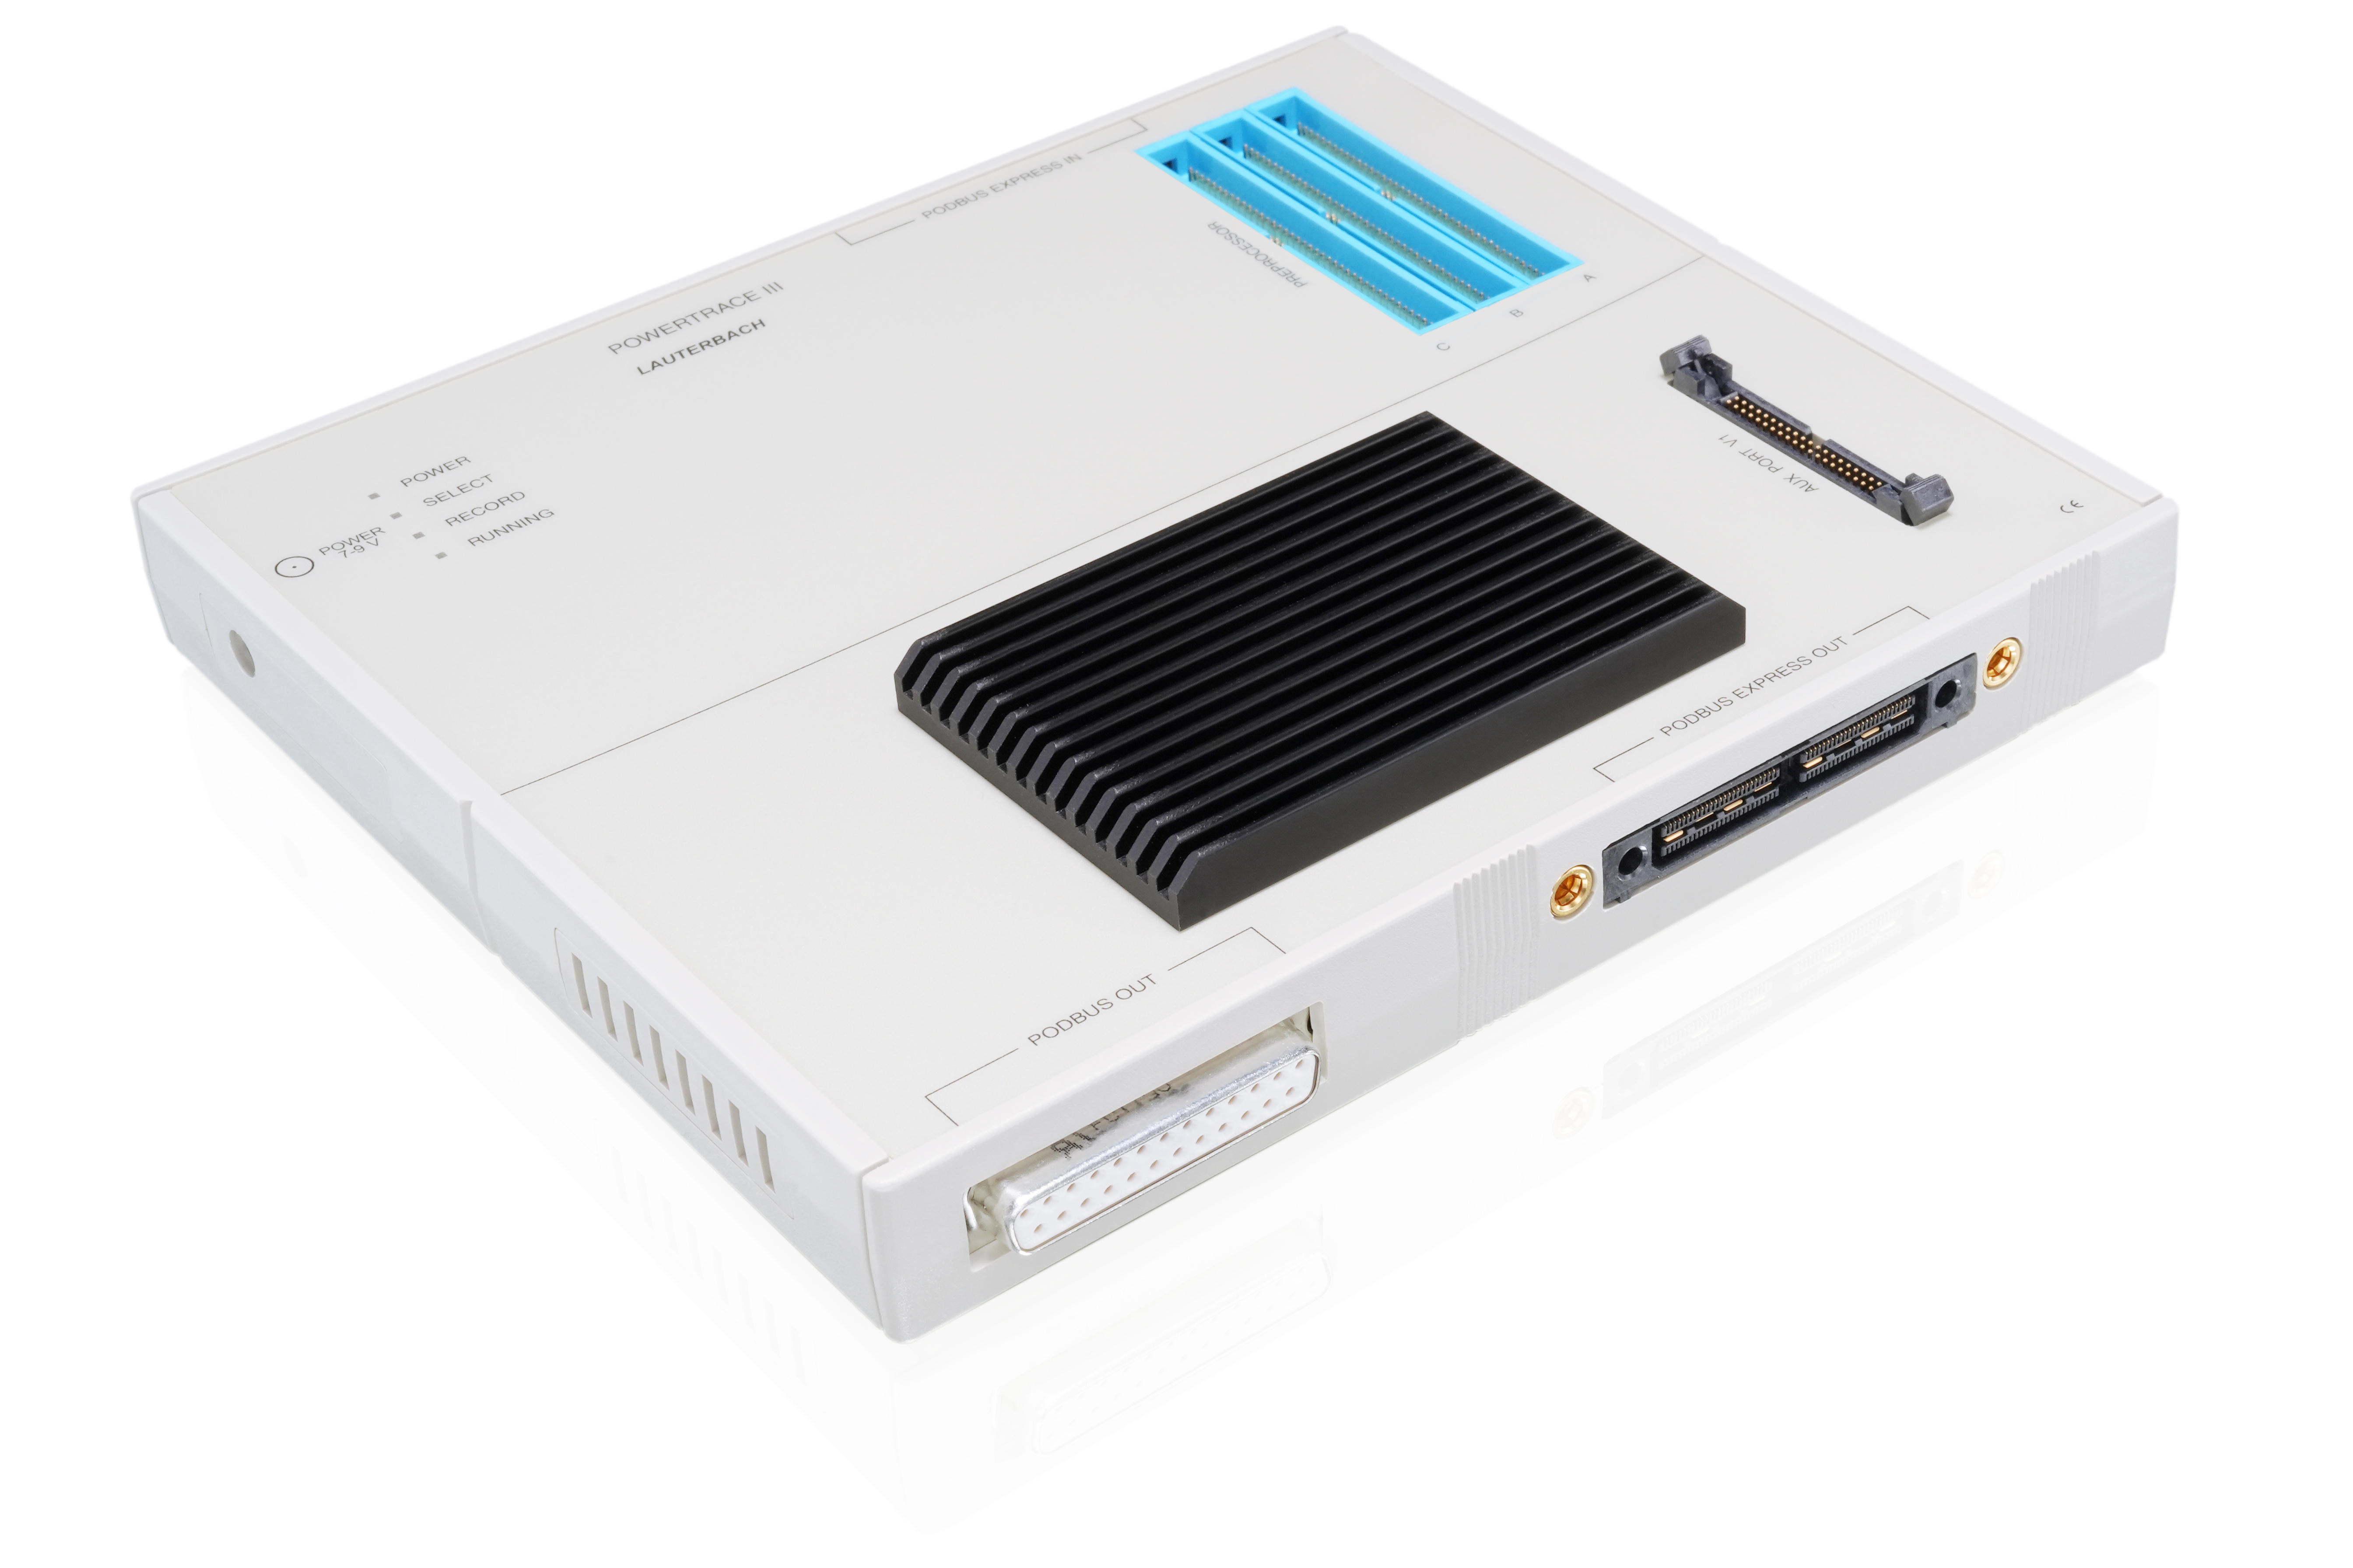
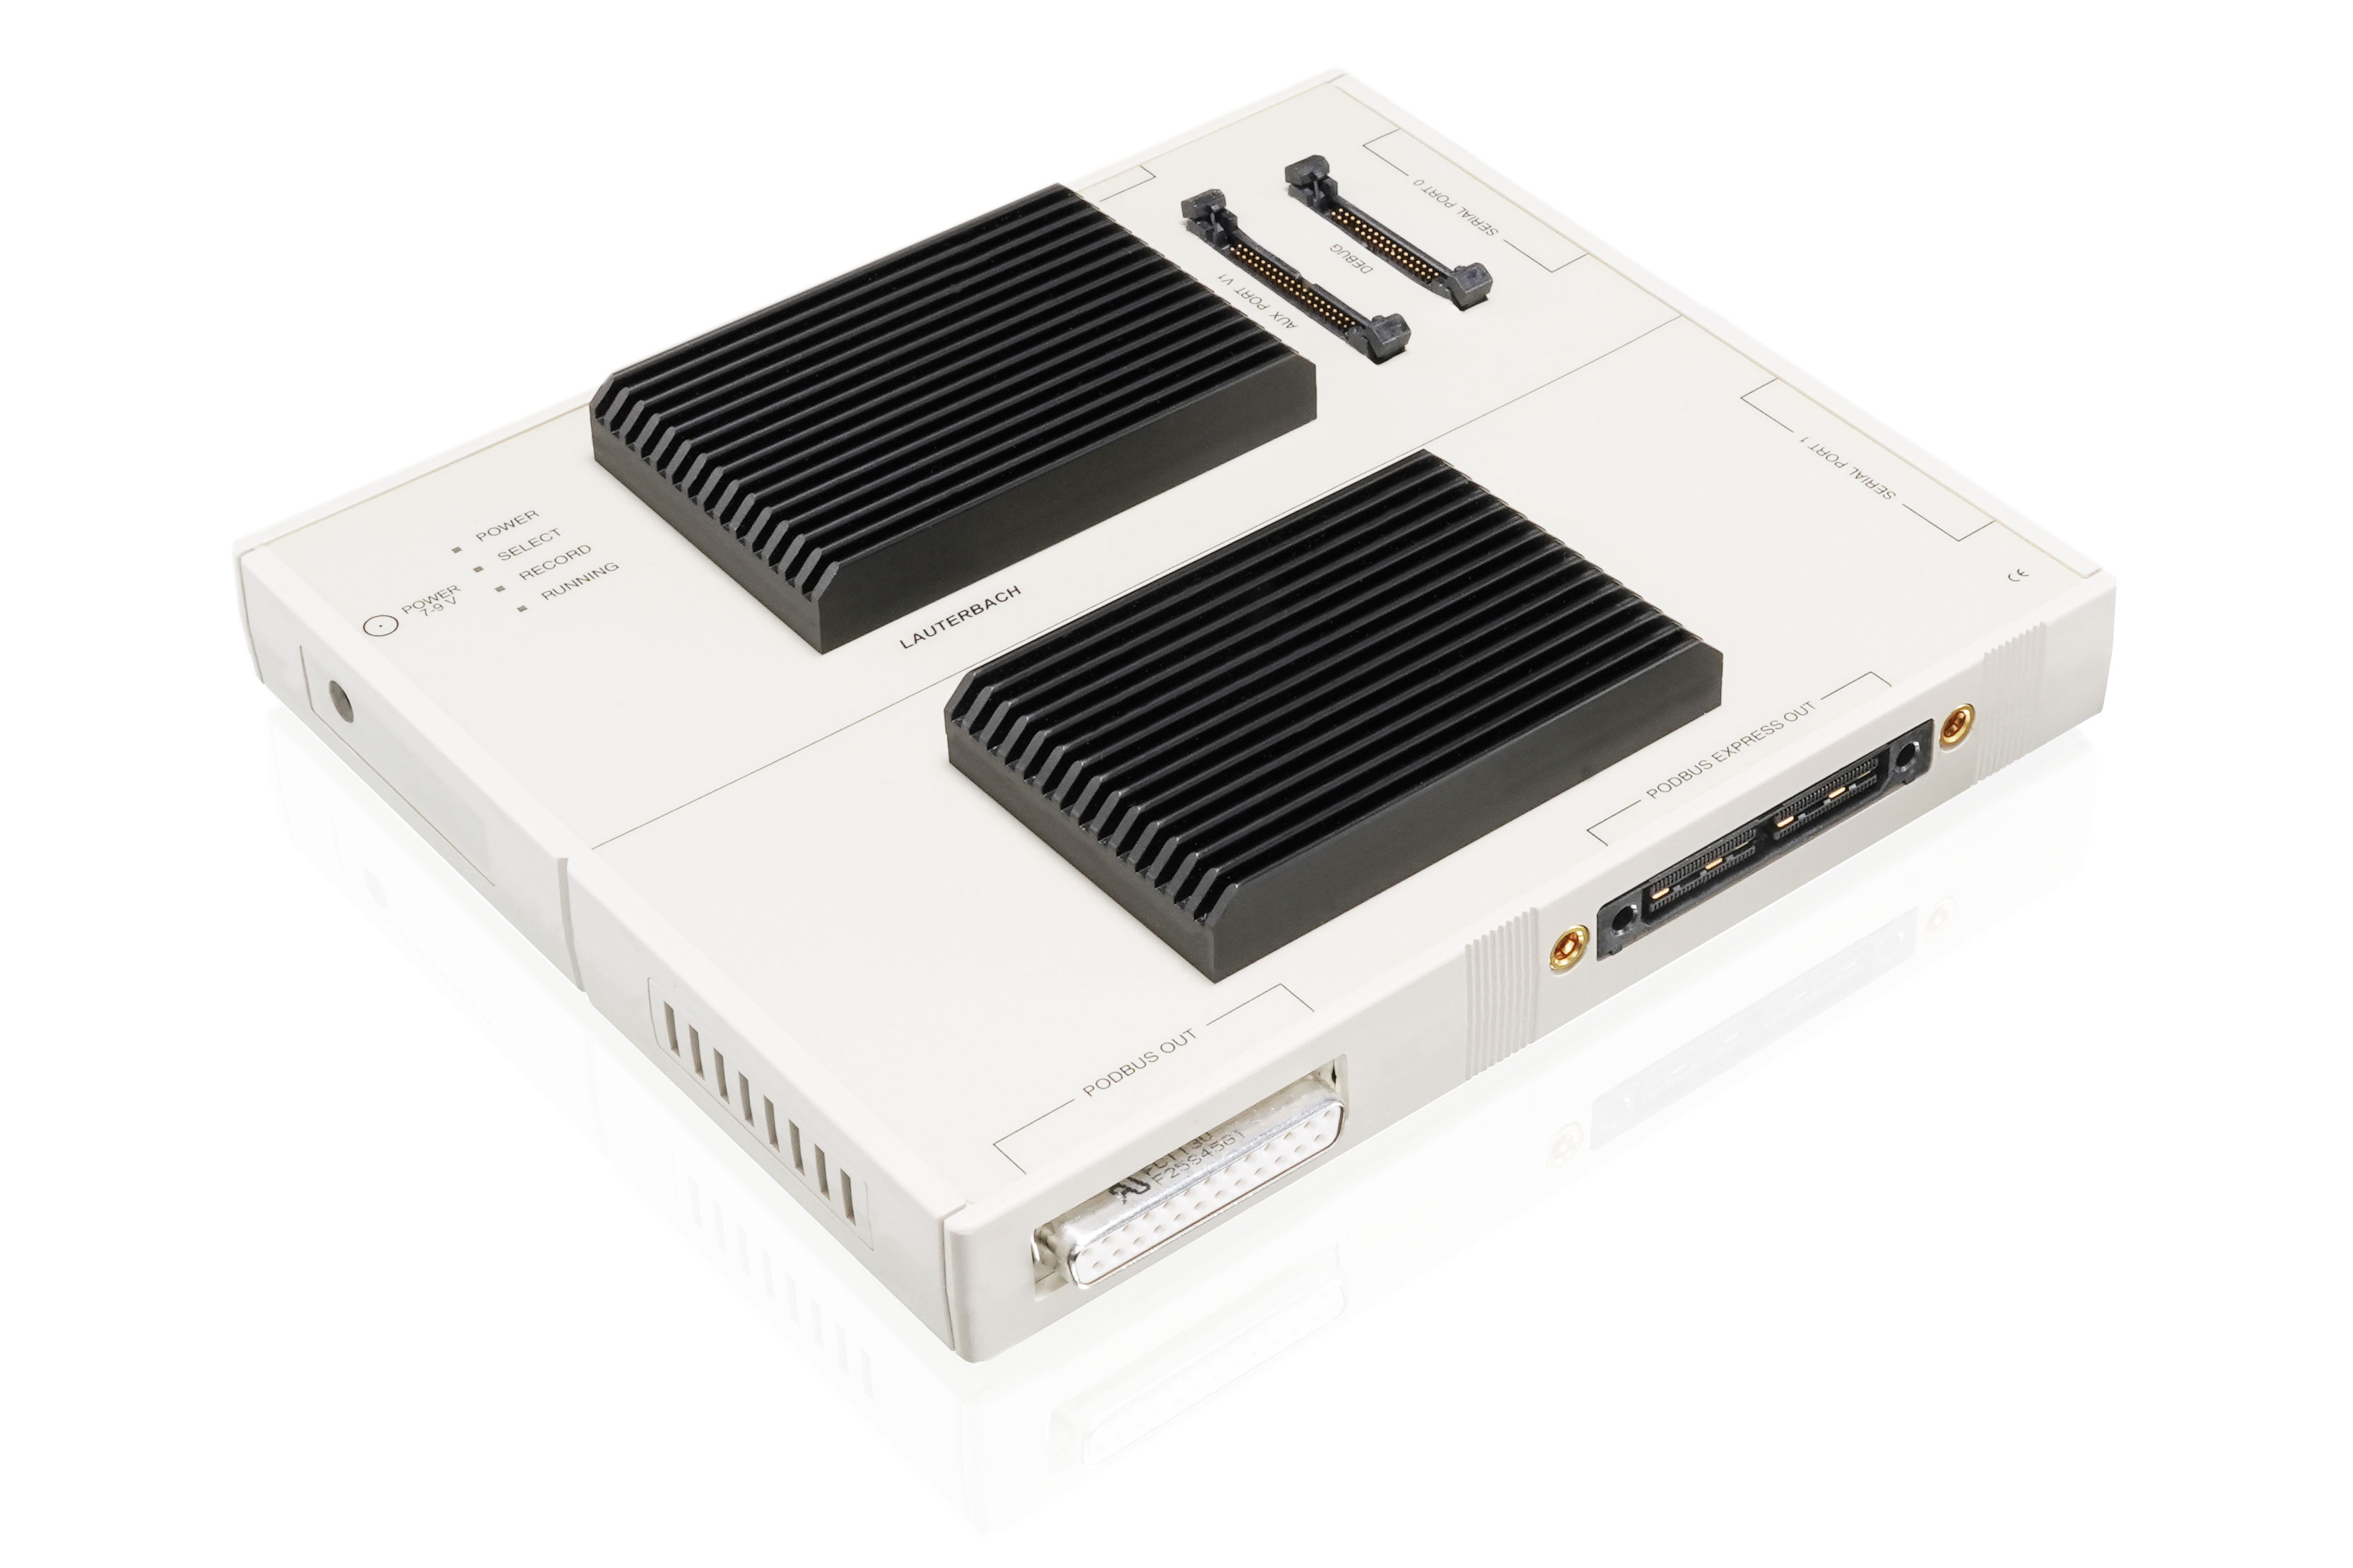
The PowerTrace extensions are part of our modular TRACE32 PowerDebug System. PowerTraces connect to the side of your PowerDebug X51 module, which provides the connection to your host PC either via USB 3 or Gigabit Ethernet. The older PowerDebug PRO and PowerDebug II will also benefit from a PowerTrace extension.
Similar to the debug probe plugged to the PowerDebug X51, you need a platform-specific connecting device between your PowerTrace and your target’s trace port – because trace ports come in all shapes and sizes. That connecting device is either a trace probe (aka. trace preprocessor) or – with PowerTrace Serial – it could be just a flex-cable or passive trace adapter.
In case your target board has a combined connector for debugging and tracing, you can connect the Debug Probe to your Lauterbach trace hardware, passing the debug signals through the trace connection.