TRACE32® Tool Qualification Support-Kit ( TQSK )
Your Trusted Tools for Functional Safety
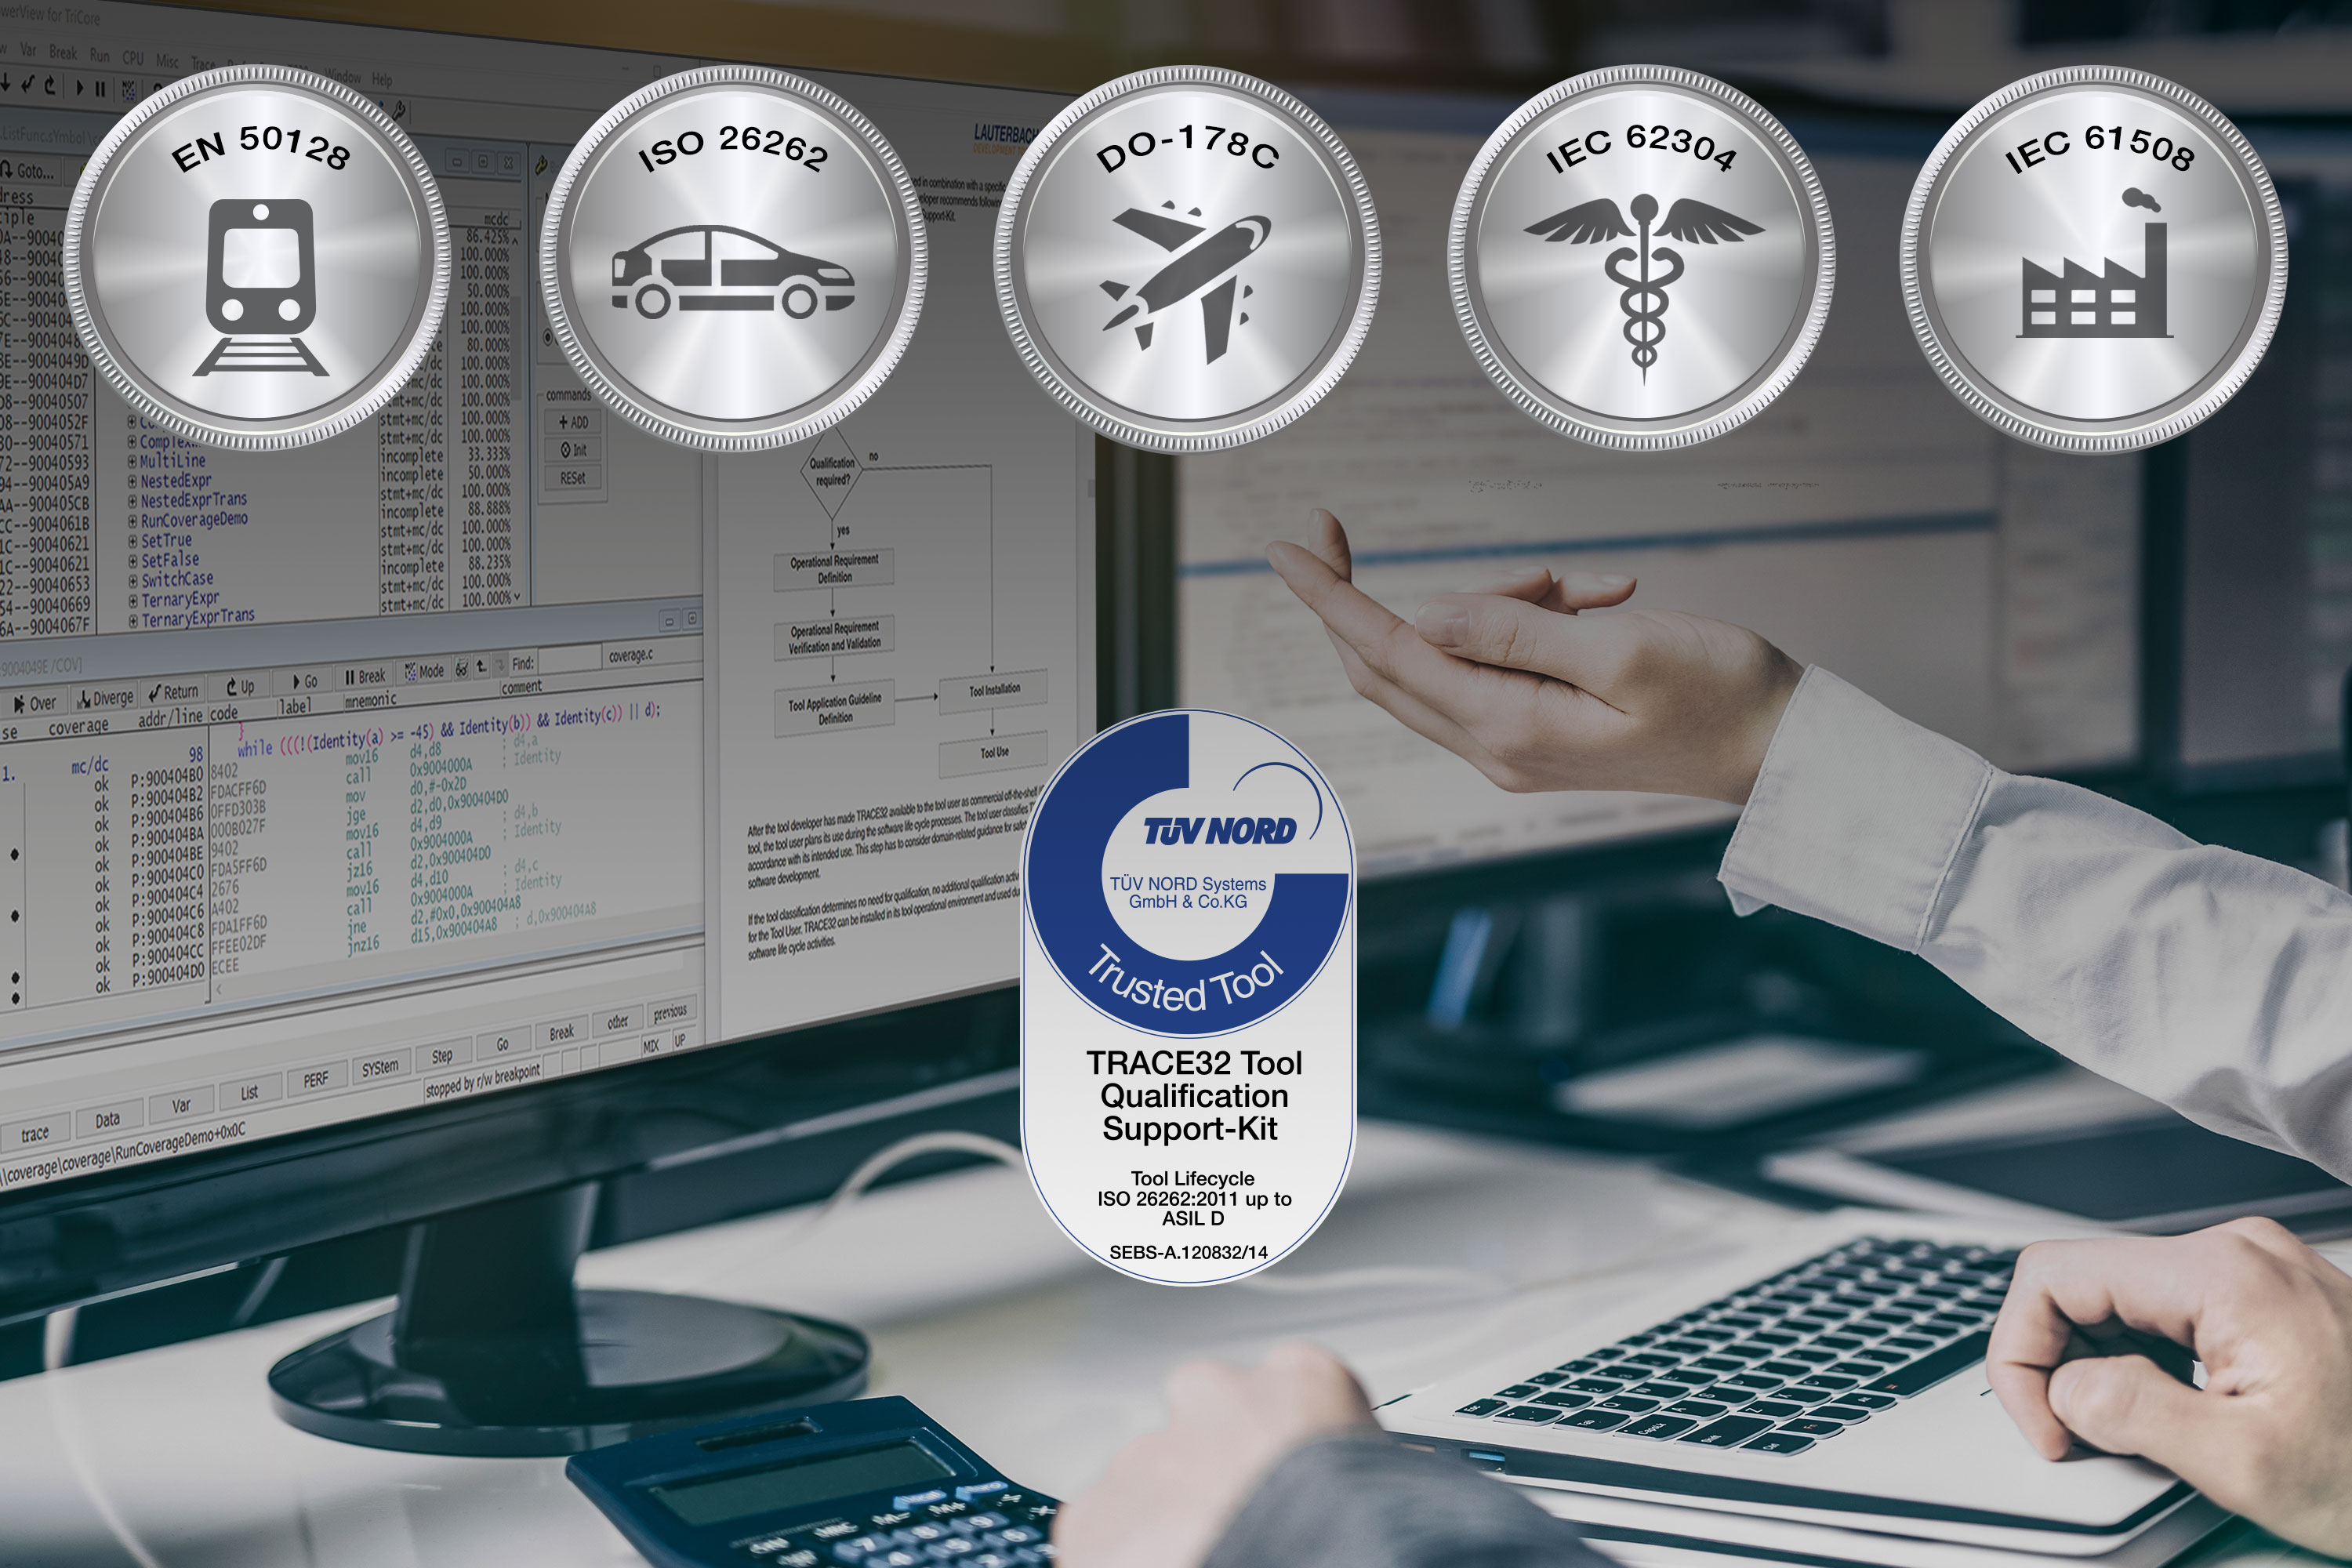
Functional safety is a key requirement for safety-critical embedded systems. Qualification also includes the development tools used and their integration into the project environment. Our certified Tool Qualification Support Kits (TQSK) provide everything you need to qualify our TRACE32 solutions. Different TQSK variants prove the suitability of code coverage, debugging, and instruction set simulator for use in avionics, medical, automotive, railroad, or general industrial projects and reduce your time-to-market, effort, and costs.
The TQSK for All of Your Embedded Applications
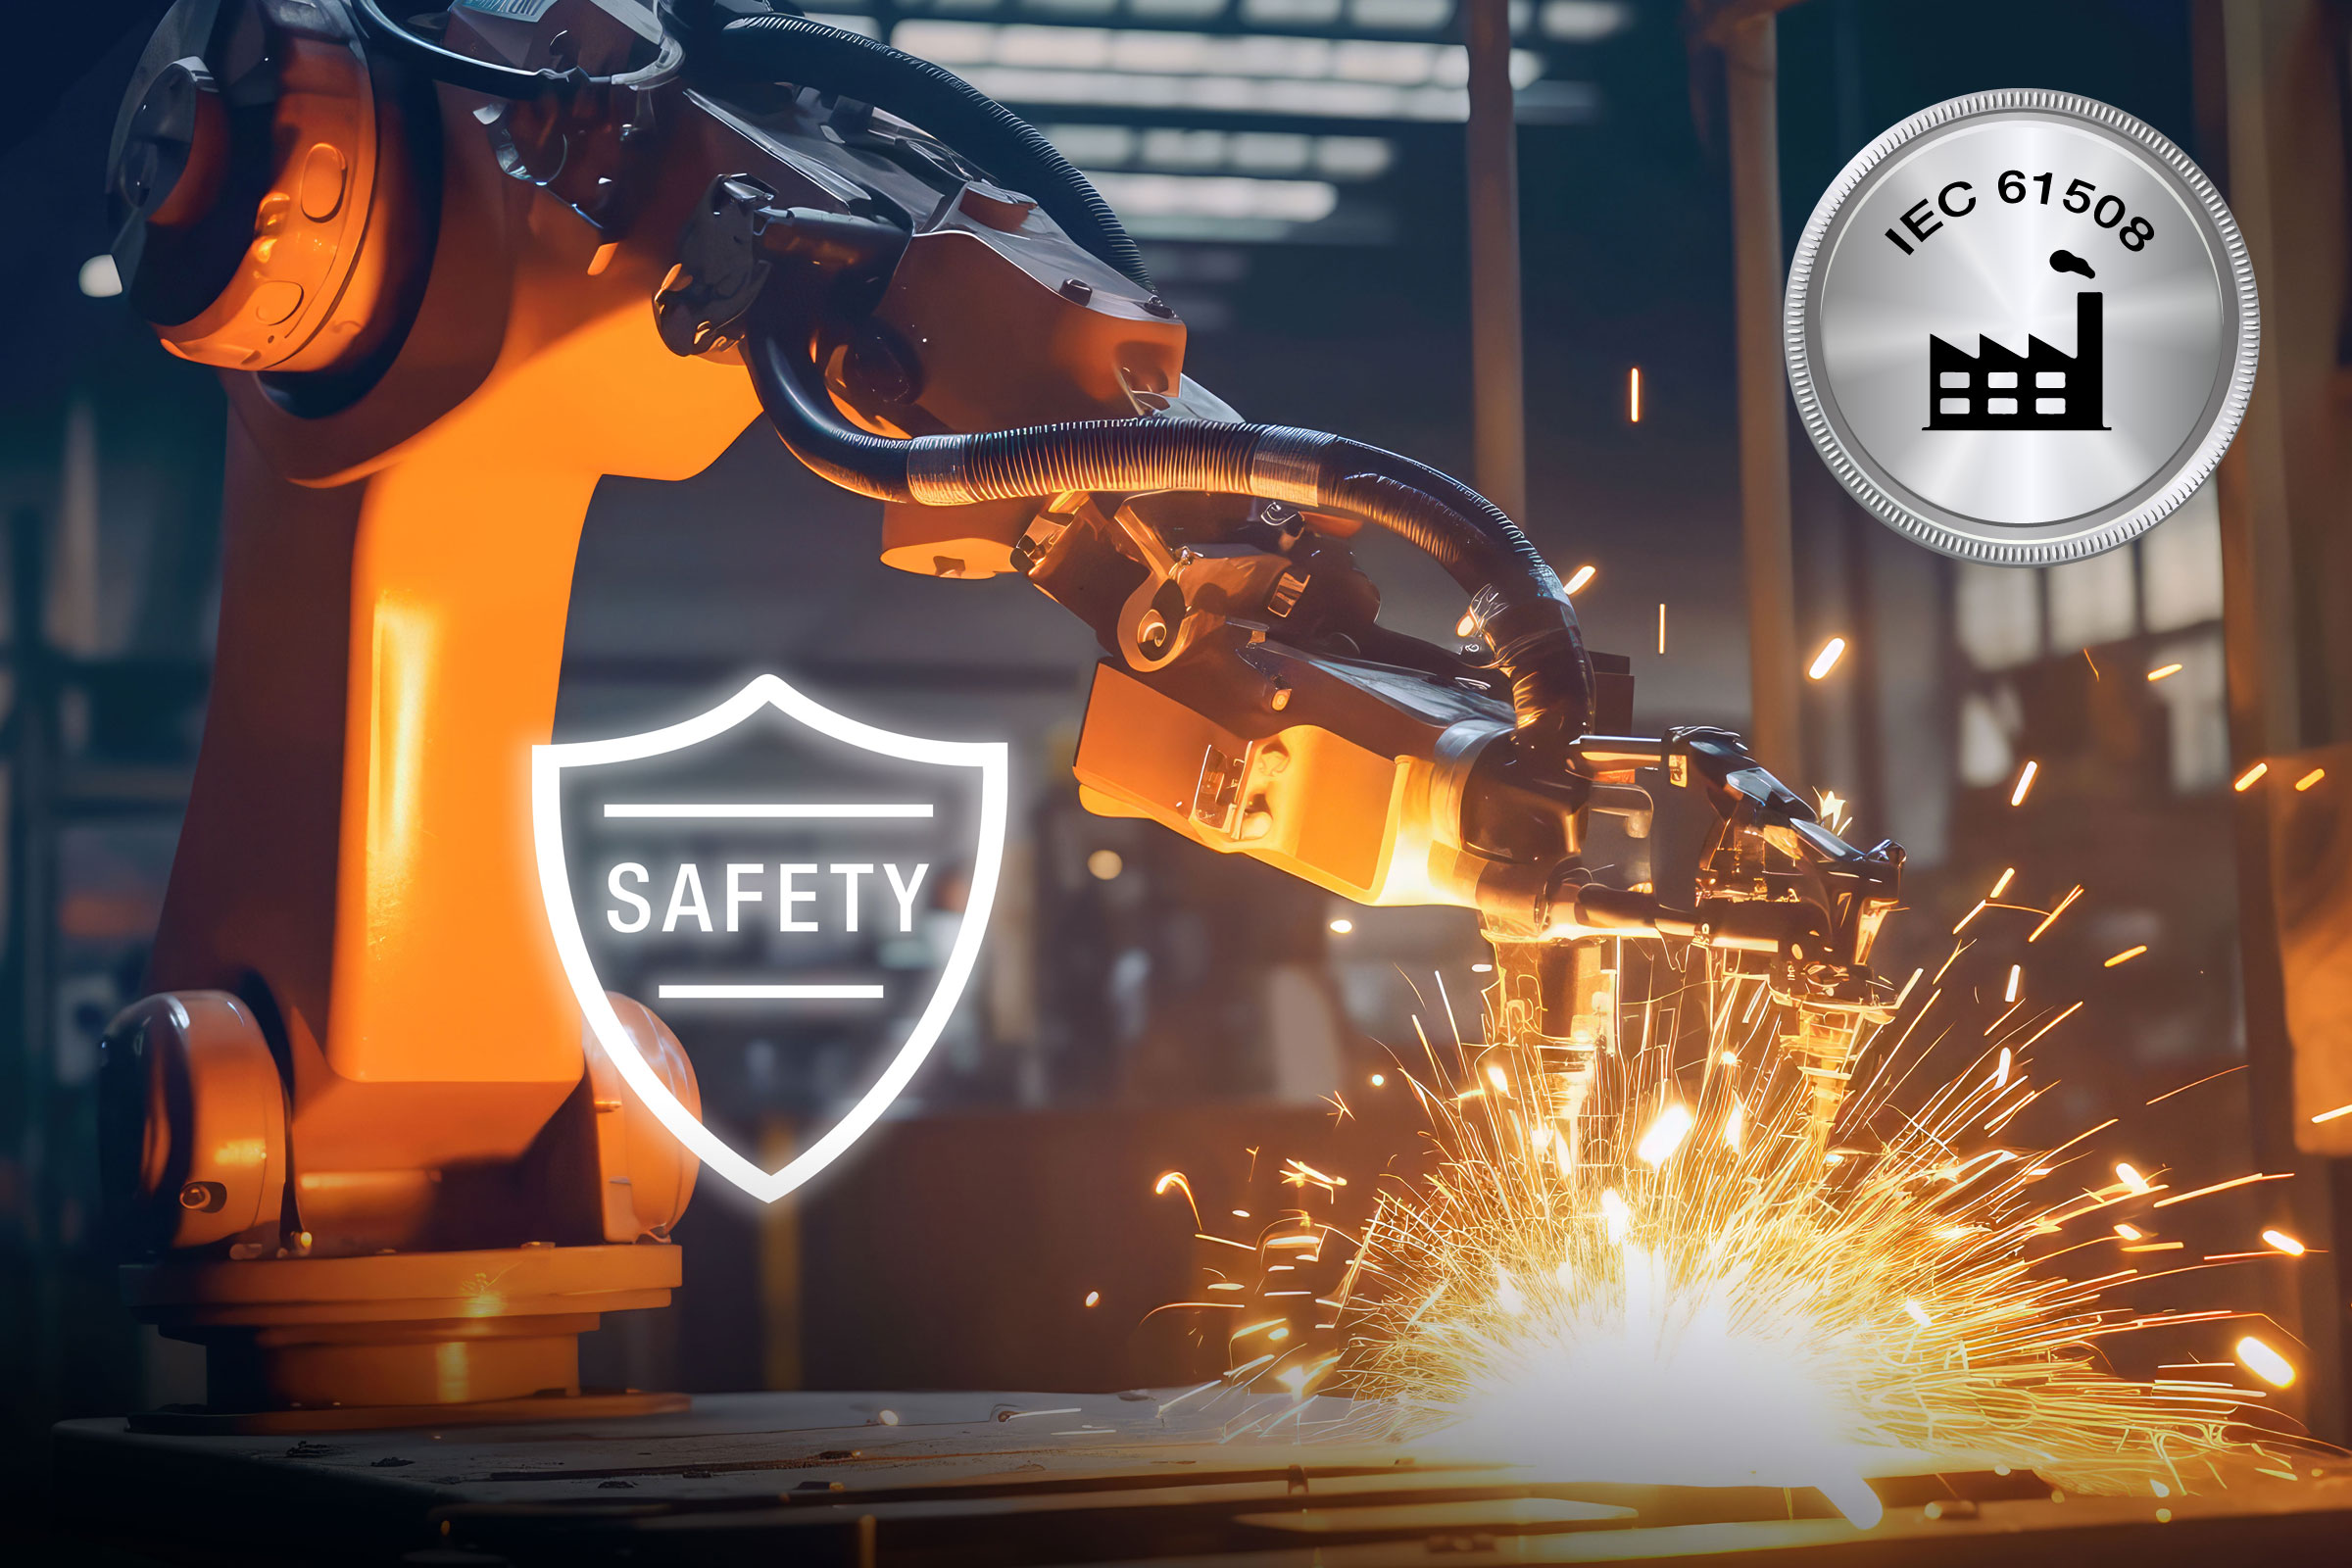
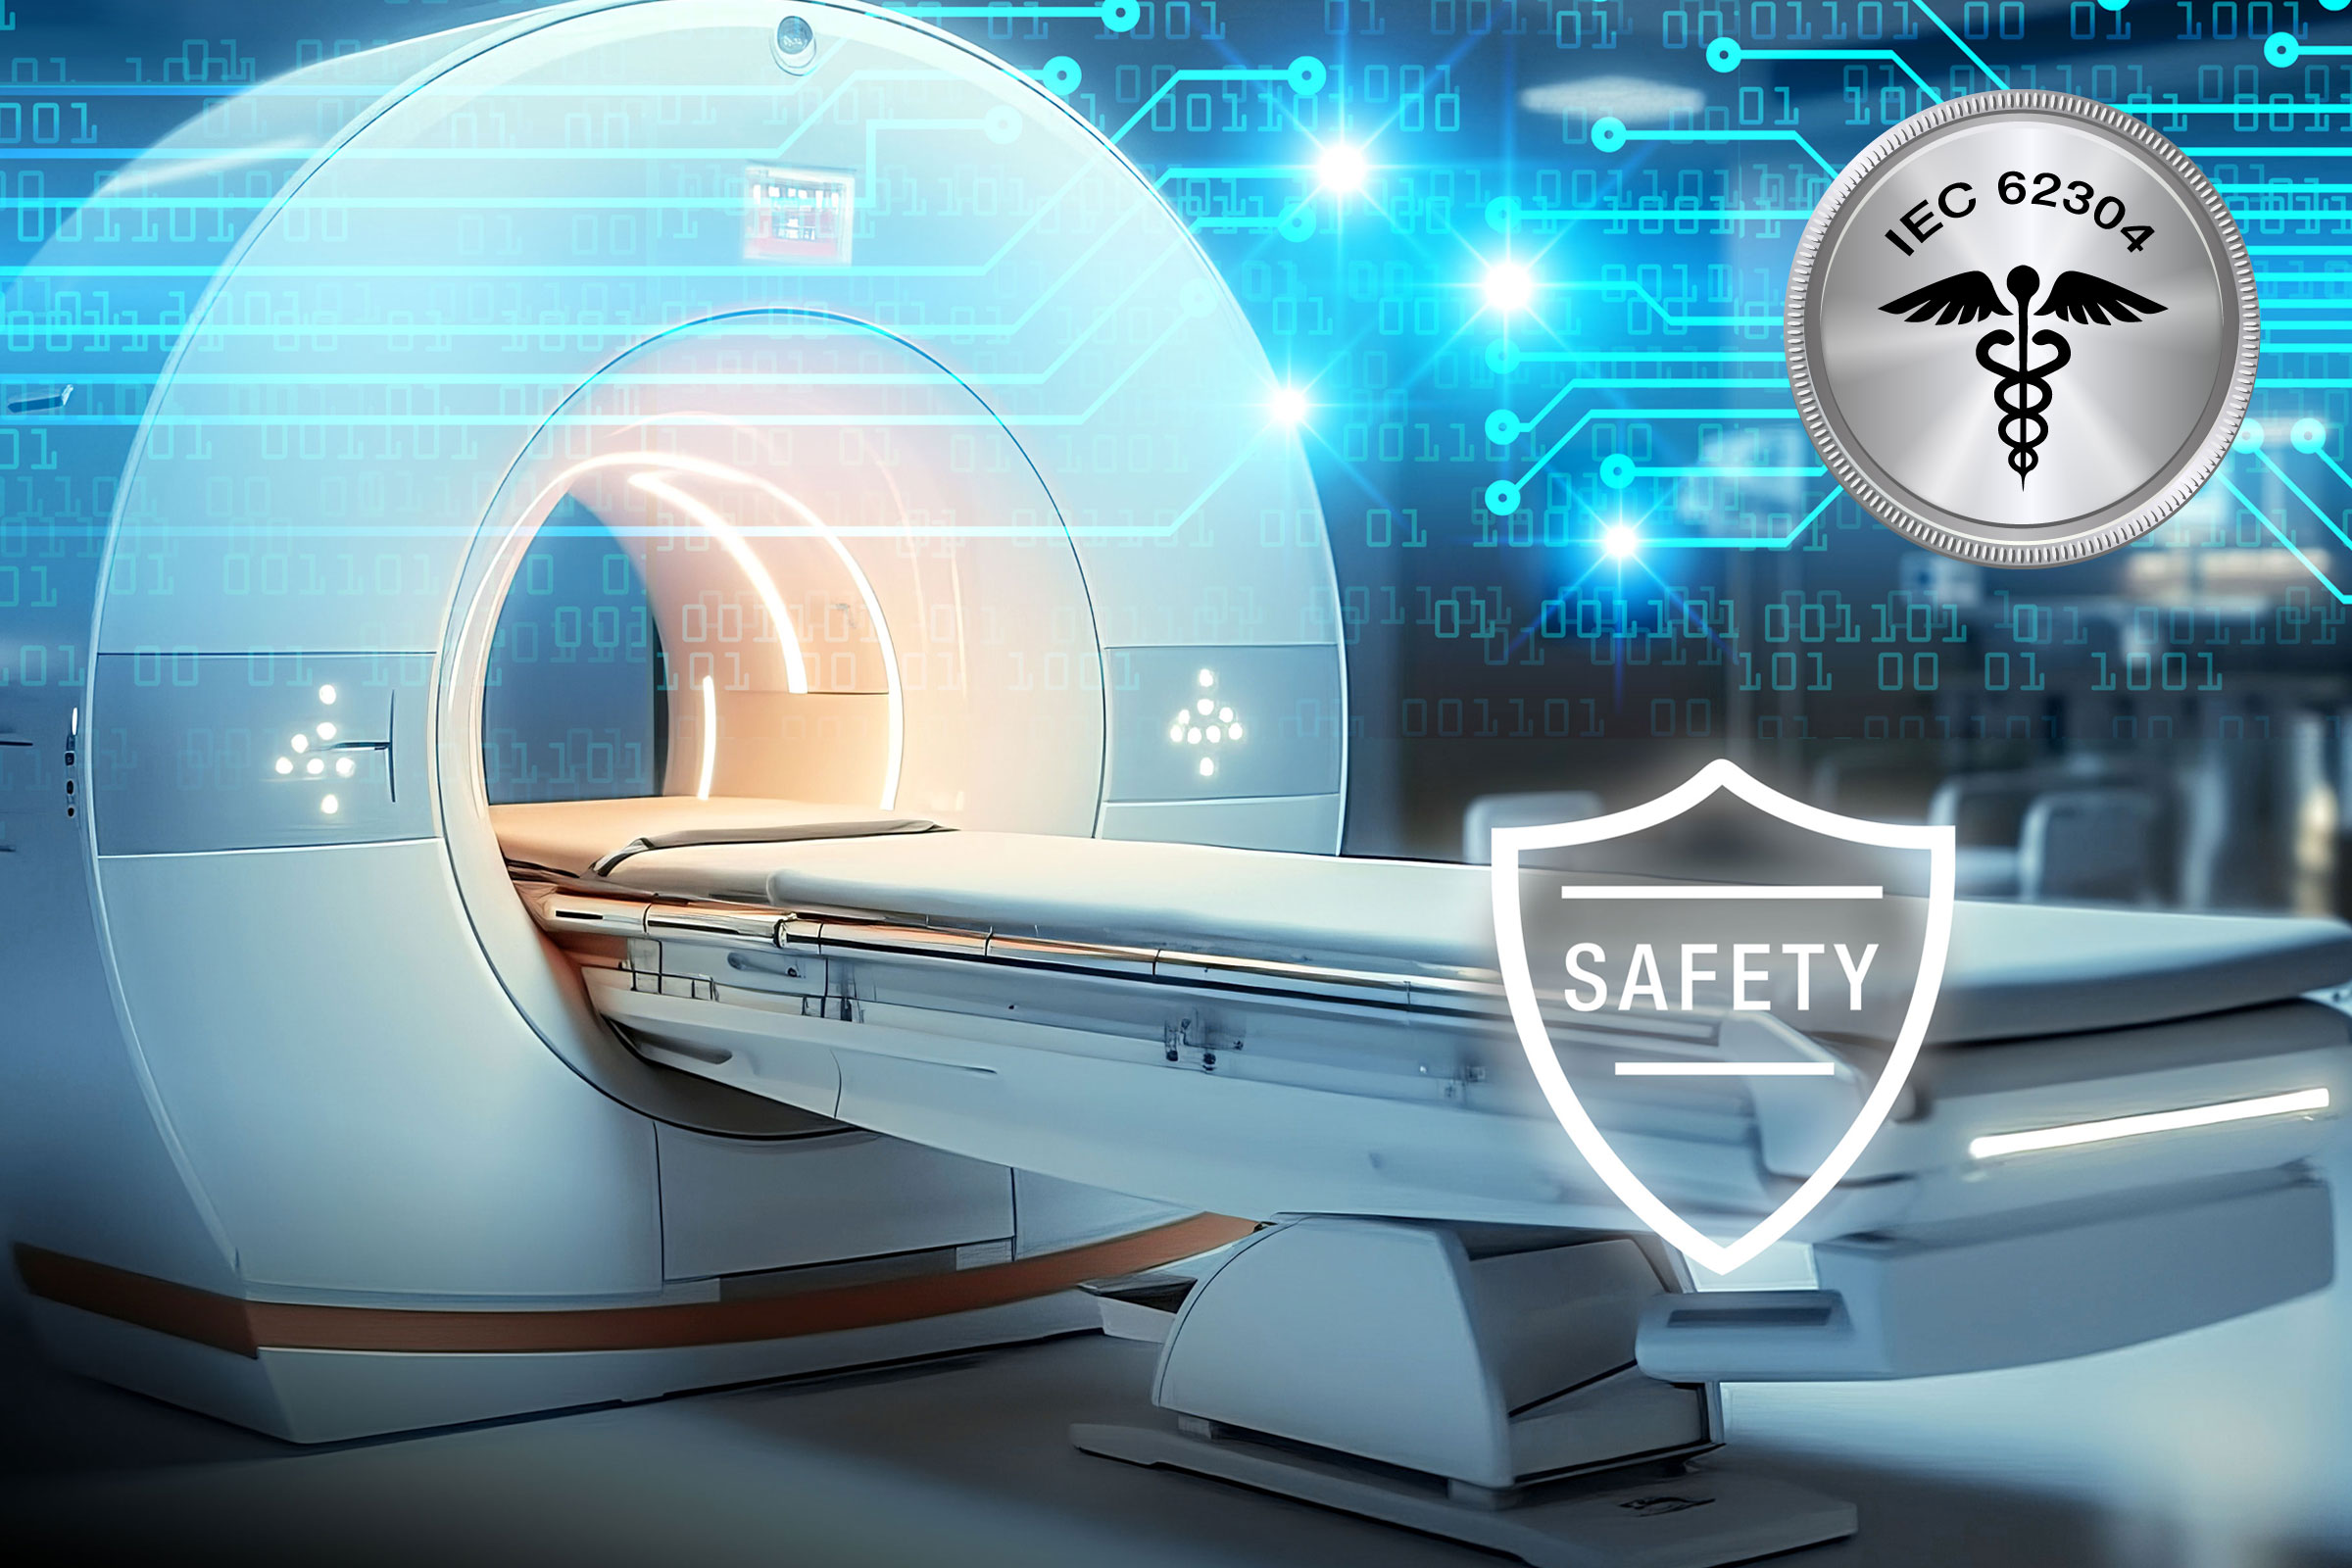
Several safety-critical industries need to comply with safety standards. Some safety standards focus on safe software development processes, others focus on system safety requirements. Our TQSK covers all the key standards that you need to fulfill in the development process of Embedded Systems in order to declare that a product is functionally safe.


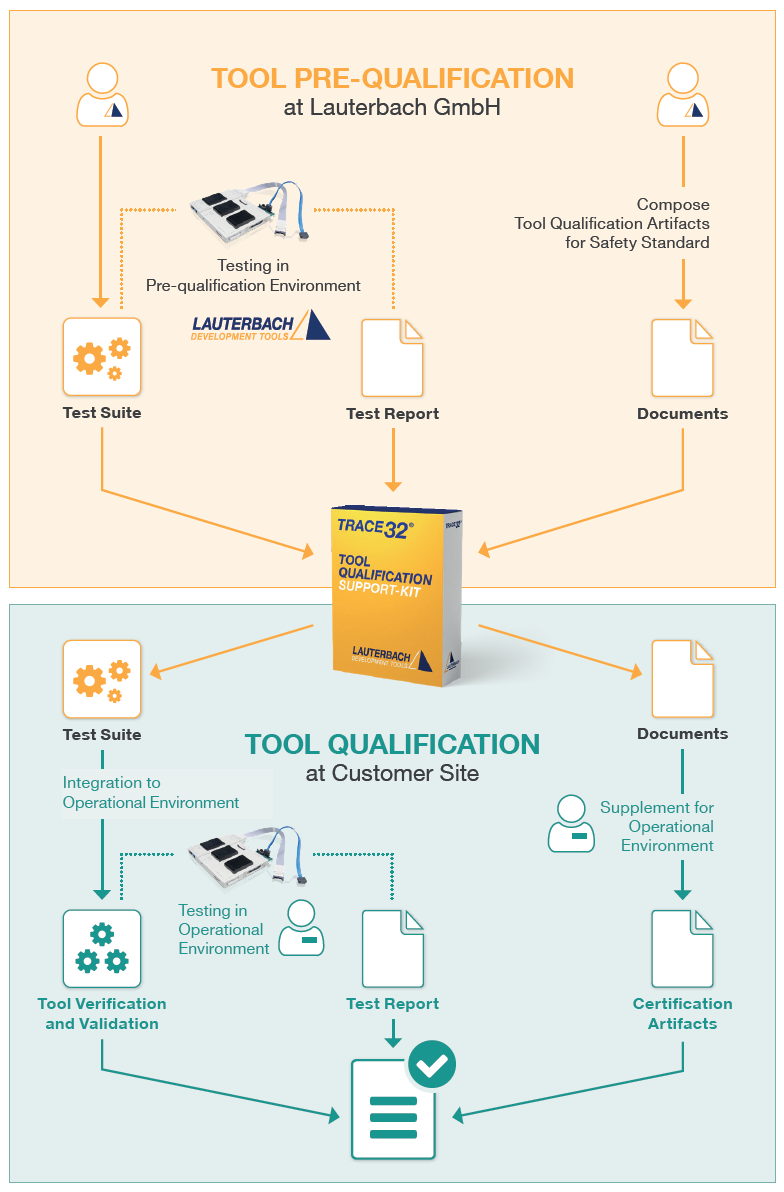
How Our 2-Stage Qualification Process Works for You
While every tool vendor including us can pre-qualify its tools, the final qualification has to be done by yourself in your specific project environment. The reason is that usually the vendor's pre-qualification environment is different from your environment, including different target architectures, toolchains, host interfaces and host operating systems. If only one of these parameters in your project environment differs from the vendor’s environment used for pre-qualification, an adaptation of test cases and documents is mandatory for your final tool qualification.
To support you in qualifying our TRACE32 debug and trace tools, we prepared the documentation required for the qualification process, developed appropriate test suites for each use case of our tools, performed a prequalification, and made the resulting data available to you in the form of our Tool Qualification Support-Kit (TQSK). You can adopt the pre-qualified test suites to your chips / architectures, easily.
Test Suite - Coverage
Prequalified with the following chips / architectures:
- TI Hercules RM57Lx -Arm Cortex-R5
- NXP MPC5777M - PowerPC MPC55xx
- Infineon Aurix TC297TF - TriCore TC27x
- ST Microelectronics Stellar SR6P7G7 - Arm Cortex-R52
- NXP MPC565 - PowerPC MPC500
- NXP M68060 - 68060
Test Suite - Debug
Prequalified with the following chips / architectures:
- Infineon Aurix TC297TF - TriCore TC27x
Qualify TRACE32 Instruction Set Simulators in your Safety-related Projects
We also provide test suites for our TriCore (including TC4x), and M68060 Instruction Set Simulators. A qualified instruction set simulator is an accepted test environment in the software module testing phase of the project and offers the following advantages:
- Product software qualification can start before product hardware is available.
- The qualification of the product software can be well organized even in a distributed team, because everything necessary is purely software-based.
- If bottlenecks occur during this phase due to a lack of development hardware or debug/trace tools, additional test benches can be easily equipped with simulators.