Debugging via XCP

Effectively Debugging Automotive ECUs in Prototypes and in the Field
In today’s automotive ECU development, software debugging and tracing as well as measurement (acquisition of internal variables of an ECU) and calibration (adjustment of internal variables) are essential techniques used during all stages of ECU development. Debug and trace tools as well as measurement and calibration (MC) tools, have been developed by different vendors in the past. In this industry, concurrent operation of multiple tools has been a necessity for many years, and the demand is ever increasing.
Typically, both tools rely on the same target debug interface and debug resources for ECU access. Physically switching both tools is often cumbersome or even impossible due to the mechanical setup. To overcome this challenge, software debugging via XCP (Universal Measurement and Calibration Protocol) allows debugging of an ECU concurrently to the engine calibration. Using our PowerView debug software with XCP enables you to use many of our world class debugging features such as multicore debugging, OS awareness and on-chip trace. Furthermore we support high-level language (HLL) debugging, flash programming, full peripheral register access using a descriptive menu tree and performance benchmark counters.
A Deeper Look Into Debugging over XCP
Debugging over XCP is based on the Universal Measurement and Calibration Protocol (XCP), which is standardized by ASAM e.V. and well established for MC applications.
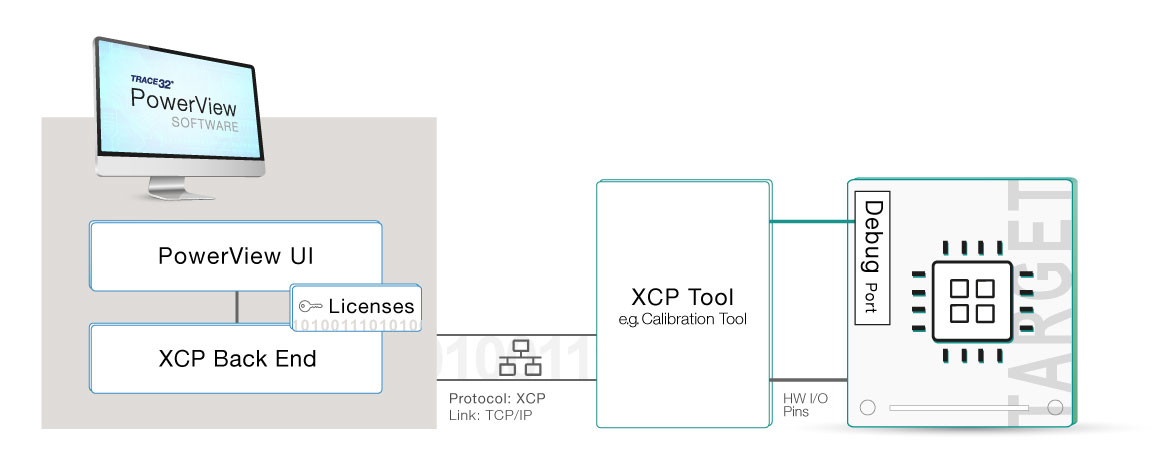
When debugging over XCP, debug commands entered via our PowerView front end are encoded into XCP commands by the XCP debug back end instead of sending them directly to the target CPU via a low-level debug protocol (e.g. JTAG, SWD or DAP). These XCP commands can either be read or write memory, perform low-level communication or access I/Os. The XCP commands are then sent over the host computer TCP stack and a network cable to the 3rd party XCP slave. The 3rd party XCP slave translates the XCP commands back into low-level debug commands.
Partnering with Major Vendors
Debugging over XCP is based on an extension of the XCP standard. This ensures interoperability between our debugger and different MC tools. As an active member of the ASAM Working Group, Lauterbach contributes to the definition and further development of the standard. We work closely with major vendors of MC tools to validate Lauterbach’s debug solutions.


Typical TRACE32 Configurations

Debug Solution for RH850
Debug your RH850 based ECU that is connected to an XCP tool.
Debug & On-Chip Trace Solution for Arm Cortex-M
Debug and trace your Arm Cortex-M based ECU that is connected to an XCP tool.
Debug & On-Chip Trace Solution for TriCore with HSM
Debug and trace your TriCore based ECU that is connected to an XCP tool. This allows concurrent debugging of all TriCore CPUs and HSM.