Energy Profiling |
 |
|||||

|
||||||
| ||||||
 Introduction
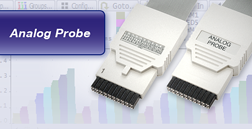
 Reducing the energy consumption is important for many embedded designs. Energy is the product of current, voltage and time. Each of these parameters can be influenced by the control software. Therefore software developers have to constantly attempt to find the optimum for these three parameters in respect to their application. Lauterbach offers two probes to measure voltage and current over time.
TRACE32 allows the recorded current and voltage to be directly correlated in time with the program flow recorded by one of the TRACE32 trace tools PowerTrace, CombiProbe or MicroTrace. This makes it easy to identify program parts with high or unexpected energy consumption. 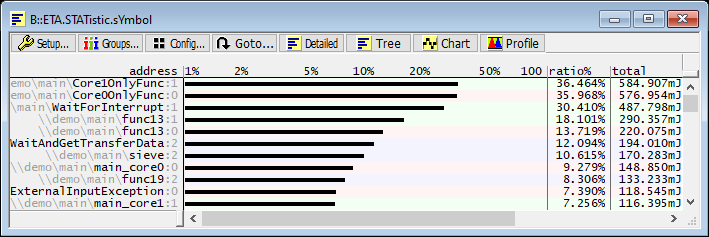
|

 12-Dec-2011: Optimizing Embedded Software Energy Consumption (Whitepaper)
|
Copyright © 2023 Lauterbach GmbH, Altlaufstr.40, 85635 Höhenkirchen-Siegertsbrunn, Germany
Impressum
Privacy Policy
The information presented is intended to give overview information only. Changes and technical enhancements or modifications can be made without notice. Report Errors Last generated/modified: 13-Jun-2023 |
